OPEN-SOURCE SCRIPT
Strong Prop Challenge Sim | ProjectSyndicate
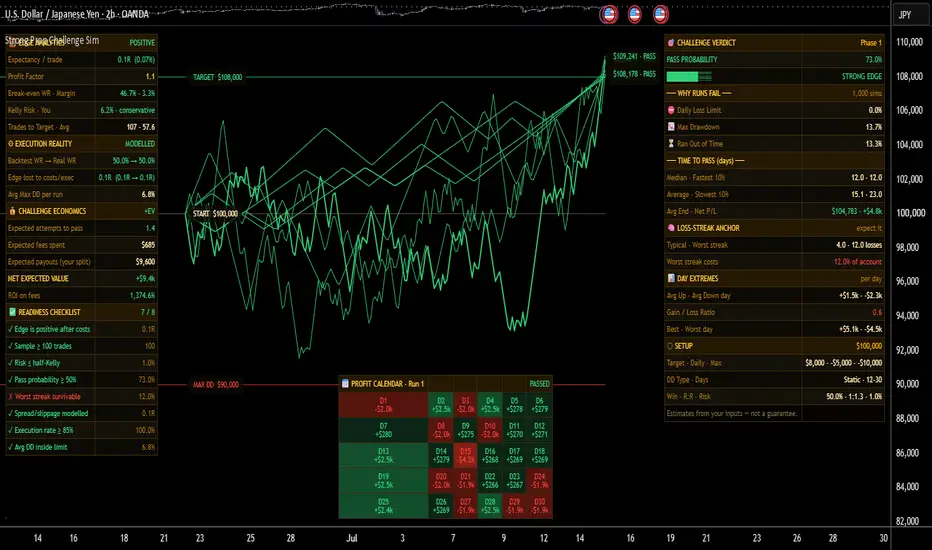
Strong Challenge Sim answers the one question every prop-firm trader pays to find out the hard way: with the edge you actually have, what are the odds you pass — and what kills you when you don't. Instead of a single pass/fail formula, it runs thousands of complete evaluations trade-by-trade and day-by-day, enforcing your firm's real rule set the way the firm enforces it: profit target, daily loss limit, maximum drawdown, minimum days, deadline, and consistency. Every simulated run is counted into exactly one outcome — passed, killed by the daily limit, killed by max drawdown, voided by the consistency rule, or out of time — so the buckets always sum to 100% and no losing run is hidden. The result is drawn as real equity curves on a real balance axis in its own pane, ranked on a two-panel dashboard, priced out in expected value, and audited against a pre-flight checklist — so you can see how the challenge behaves on your numbers before you pay a fee.

🎲 Monte-Carlo Core — the core idea, expressed as a lifecycle: EDGE ▸ TRADES ▸ DAYS ▸ RULES ▸ VERDICT. Your edge is defined per trade — win rate, reward:risk, average loss in R, risk basis and size, trades per day. The engine plays that edge forward one trade at a time, accumulates each day, and after every single trade it checks the rule stack in the same order a firm's risk system does: has equity touched the maximum-drawdown floor, has the day's loss breached the daily limit, has the profit target been reached, and have the minimum trading days been served. The drawdown floor itself is modelled three ways — Static from your starting balance, Trailing from the equity peak, or Trailing → locks once the floor reaches your starting balance — because that single rule changes the answer more than almost anything else. Phase 1, Phase 2, or both back-to-back. A deterministic seed makes every result reproducible; change it to draw a different sample.
📈 Equity Simulator — the whole point is to watch the runs, so the indicator lives in its own pane on a true balance axis rather than fighting your price scale. Up to eight complete simulated challenges are drawn as full equity curves, stretched across an adjustable width, each coloured by how it actually ended: green passed, orange died on the daily loss limit, red blew the maximum drawdown, blue passed the target but was voided by the consistency rule, grey ran out of time. Every curve prints its ending balance and outcome at its right edge, and the Target, Start, and Max-DD reference lines are labelled with their real money values — so you read the balances directly instead of guessing at the scale.
🧮 Edge Analytics — the deterministic maths behind the simulation, stated plainly: expectancy per trade in R and as a percentage of equity, theoretical profit factor, break-even win rate, your margin above or below it, the Kelly-optimal risk with a verdict on the risk you actually chose (conservative / aggressive / OVER-BET), and the estimated number of trades to reach target alongside the average the simulation really needed. If the edge is negative, this is where it shows up first — no number of simulations fixes maths that doesn't work.
⚙️ Execution Reality — the section most calculators pretend doesn't exist, and the reason backtests flatter you. Two costs are modelled explicitly. Spread and slippage are charged on every single trade in R, shrinking every winner and deepening every loser, because clean mid-price backtesting overstates performance. Execution Rate captures the gap between the strategy and the operator: the share of setups you actually take by the rules, with the remainder taken as marginal, late, off-rule entries at a degraded win rate. The panel then shows your Backtest WR → Real WR and the exact R your edge loses to costs and execution. Improving execution is frequently worth more than optimising the strategy.
🧠 Loss-Streak Anchor — the psychological instrument. The engine records the longest run of consecutive losers in every simulation and reports the typical and worst streak you should expect, then converts the worst one into what it actually costs as a percentage of your account. This is the number that stops you revenge-trading on loss four when your own data says six is normal — and it is also a hard risk test: if your worst plausible streak costs more than the maximum drawdown, the challenge is unsurvivable at that risk size no matter how good the headline pass probability looks.

💰 Challenge Economics — a challenge is a purchase, so it gets priced like one. Enter the fee, whether it's refunded on first payout, your profit split, the profit you expect per payout cycle, and how many cycles you realistically expect to collect. The panel returns the expected number of attempts to pass, the total fees you should expect to spend getting there, your expected payouts, the net expected value of the whole venture, and the ROI on fees — flagged +EV or −EV. A 99% pass probability and a −EV verdict can coexist; this is where you find out.
📅 Profit Calendar — a day-by-day heat map of one sample run, up to thirty trading days, green for up days and red for down days with the intensity scaled to the size of the move and the P/L printed in each cell, plus that run's final outcome. It turns an abstract probability into a story you can read: where the drawdown hit, which day carried the account, and whether one outsized day is quietly setting up a consistency-rule violation.
⚖️ Rule-Profile Comparison — your identical edge run against six different rule sets side by side, showing target, daily limit, maximum drawdown and the resulting pass probability, with your own rules marked. Profiles are labelled by their actual numbers and drawdown type rather than by brand, because firm terms change and the rules are what the maths responds to. The same trader can be comfortably profitable under one rule set and mathematically doomed under another — this makes that visible before you choose.
🔥 Sensitivity Grid — an optional 5×5 heat grid re-running the simulation across a range of win rates and reward:risk ratios around your inputs, colour-graded by pass probability with your base case marked. It shows how fragile or robust your pass odds are: whether you sit on a plateau where a small slip still passes, or on a cliff edge where two points of win rate is the difference between funded and refunded.
✅ Readiness Checklist — the pre-flight audit, scored out of eight, every box ✓ before you pay: the edge is positive after costs, the sample behind your numbers is at least 100 trades, risk sits at or below half-Kelly, pass probability clears 50%, the worst loss streak is survivable inside the maximum drawdown, spread and slippage are actually modelled, execution rate is at least 85%, and the average drawdown per run stays inside the limit. Each item shows the value it was judged on, so a ✗ tells you exactly what to fix.
📊 Two-Panel Dashboard — the read-out is split into two panels so it fits on a normal screen. Panel A — Results carries the verdict with a pass-probability bar and a plain-language rating, the full failure breakdown by cause, time to pass as median / fastest 10% / average / slowest 10% with the average ending balance and net P/L, the loss-streak anchor, day extremes (average up day, average down day, gain/loss ratio, best and worst day), and your setup summary. Panel B — Edge & Economics carries edge analytics, execution reality, challenge economics, and the readiness checklist. Both panels, the calendar, the comparison and the grid can each be placed in any of nine screen slots at three text sizes, so nothing overlaps whatever else you run.
🎚️ Discipline & Behaviour Controls — rules you impose on yourself, tested rather than assumed. A daily profit lock stops the day after +X R; a circuit breaker stops it after −Y R. Tilt / revenge sizing models the classic killer: after a chosen number of consecutive losses, risk is multiplied — switch it on and watch the daily-loss failure rate climb. The consistency rule caps how much of total profit a single day may carry and voids passes that breach it, exactly as firms do. Variable R randomises win and loss sizes around your averages for extra realism.
🔔 Alerts — fires on a positive edge (expectancy above 0R after costs) and on a negative edge, the latter being the one that matters: it means the challenge maths does not work at your current inputs, regardless of how the curves happen to look.
🔧 Fully Customizable — every component is exposed: account size, currency symbol and phase; both profit targets, daily and maximum drawdown, drawdown type, minimum days, deadline, and the consistency rule with its threshold; win rate, reward:risk, average loss in R, risk basis (current equity / starting balance / fixed amount), risk size, trades per day, and the sample size behind your numbers; spread and slippage in R, execution rate, off-rule win rate, and tilt with its trigger and multiplier; the profit lock and circuit breaker; fee, refund, split, payout percentage and payout count; simulation count, seed, and R randomisation; curve count, curve width, reference lines and balance labels; and every panel, module, position and text size.

🎯 Why this is different — a pass-probability calculator gives you one number from a formula and stops. This runs the entire evaluation thousands of times under the firm's real rule stack, tells you not just whether you pass but precisely what kills you when you don't, charges you for spread and for the trades you don't take properly, hands you the loss streak you must be able to sit through, prices the attempt in expected value rather than hope, checks your readiness against eight objective boxes, and draws the whole thing as honest equity curves where every stop-out is counted. It is built to talk you out of a bad challenge, not into one.
🚀 Where to use it — the simulator is symbol- and timeframe-agnostic: it models your trading edge and your firm's rules, not the chart it sits on, so you can leave it on any instrument on any timeframe and the answer is the same. Load the chart you actually intend to trade for context, feed it the win rate and reward:risk from your own backtest or journal on that market, and set the rule inputs to your specific target firm — different firms' rules produce materially different answers from the identical edge.
🎯 How to use it
Enter your firm's rules exactly — target, daily limit, maximum drawdown, and above all the correct drawdown type, since Static, Trailing and Trailing → Lock are not interchangeable.
Enter your real edge from a real sample — win rate, reward:risk, average loss in R, risk per trade and trades per day — and set the sample size honestly. Under 100 trades, the checklist will flag your numbers as statistically meaningless, and it is right.
Set the execution reality before you believe anything — put your true spread and slippage in R, and set your execution rate to what you actually achieve, not what you intend. Watch Backtest WR → Real WR.
Read the verdict, then read why runs fail — the failure breakdown tells you what to fix. Daily-limit failures mean size or tilt; max-drawdown failures mean the edge or the risk; timeouts mean the target is out of reach in the time allowed.
Check the loss-streak anchor and the checklist before the pass probability — a 99% pass probability with an unsurvivable worst streak is a tail risk, not a green light.
Price it in Panel B — if the net expected value is negative, the challenge is a bad purchase however good the odds look.
Tune risk with the Kelly verdict and the sensitivity grid, and re-check the calendar for consistency-rule exposure if your firm enforces one.
⚠️ Important — this is a planning and decision-support tool, not a trading system, and it makes no performance guarantees. Every output is a probabilistic estimate derived entirely from the inputs you provide: the simulation cannot know your real edge, and garbage in is garbage out with three decimal places. Real markets are not independent coin flips — they cluster, trend, gap and change regime, while the model assumes each trade is an independent draw from your stated win rate, so treat the results as the mathematical shape of your challenge rather than a forecast of it. Pass probability is the headline and the least useful number on its own; weigh it against the failure breakdown, the loss-streak anchor, average drawdown and expected value. Rule sets vary between firms and change over time — verify every rule against your firm's current terms, particularly the drawdown type and any consistency requirement. No simulation, however honest, is a substitute for a tested edge and your own risk management.
🎲 Monte-Carlo Core — the core idea, expressed as a lifecycle: EDGE ▸ TRADES ▸ DAYS ▸ RULES ▸ VERDICT. Your edge is defined per trade — win rate, reward:risk, average loss in R, risk basis and size, trades per day. The engine plays that edge forward one trade at a time, accumulates each day, and after every single trade it checks the rule stack in the same order a firm's risk system does: has equity touched the maximum-drawdown floor, has the day's loss breached the daily limit, has the profit target been reached, and have the minimum trading days been served. The drawdown floor itself is modelled three ways — Static from your starting balance, Trailing from the equity peak, or Trailing → locks once the floor reaches your starting balance — because that single rule changes the answer more than almost anything else. Phase 1, Phase 2, or both back-to-back. A deterministic seed makes every result reproducible; change it to draw a different sample.
📈 Equity Simulator — the whole point is to watch the runs, so the indicator lives in its own pane on a true balance axis rather than fighting your price scale. Up to eight complete simulated challenges are drawn as full equity curves, stretched across an adjustable width, each coloured by how it actually ended: green passed, orange died on the daily loss limit, red blew the maximum drawdown, blue passed the target but was voided by the consistency rule, grey ran out of time. Every curve prints its ending balance and outcome at its right edge, and the Target, Start, and Max-DD reference lines are labelled with their real money values — so you read the balances directly instead of guessing at the scale.
🧮 Edge Analytics — the deterministic maths behind the simulation, stated plainly: expectancy per trade in R and as a percentage of equity, theoretical profit factor, break-even win rate, your margin above or below it, the Kelly-optimal risk with a verdict on the risk you actually chose (conservative / aggressive / OVER-BET), and the estimated number of trades to reach target alongside the average the simulation really needed. If the edge is negative, this is where it shows up first — no number of simulations fixes maths that doesn't work.
⚙️ Execution Reality — the section most calculators pretend doesn't exist, and the reason backtests flatter you. Two costs are modelled explicitly. Spread and slippage are charged on every single trade in R, shrinking every winner and deepening every loser, because clean mid-price backtesting overstates performance. Execution Rate captures the gap between the strategy and the operator: the share of setups you actually take by the rules, with the remainder taken as marginal, late, off-rule entries at a degraded win rate. The panel then shows your Backtest WR → Real WR and the exact R your edge loses to costs and execution. Improving execution is frequently worth more than optimising the strategy.
🧠 Loss-Streak Anchor — the psychological instrument. The engine records the longest run of consecutive losers in every simulation and reports the typical and worst streak you should expect, then converts the worst one into what it actually costs as a percentage of your account. This is the number that stops you revenge-trading on loss four when your own data says six is normal — and it is also a hard risk test: if your worst plausible streak costs more than the maximum drawdown, the challenge is unsurvivable at that risk size no matter how good the headline pass probability looks.
💰 Challenge Economics — a challenge is a purchase, so it gets priced like one. Enter the fee, whether it's refunded on first payout, your profit split, the profit you expect per payout cycle, and how many cycles you realistically expect to collect. The panel returns the expected number of attempts to pass, the total fees you should expect to spend getting there, your expected payouts, the net expected value of the whole venture, and the ROI on fees — flagged +EV or −EV. A 99% pass probability and a −EV verdict can coexist; this is where you find out.
📅 Profit Calendar — a day-by-day heat map of one sample run, up to thirty trading days, green for up days and red for down days with the intensity scaled to the size of the move and the P/L printed in each cell, plus that run's final outcome. It turns an abstract probability into a story you can read: where the drawdown hit, which day carried the account, and whether one outsized day is quietly setting up a consistency-rule violation.
⚖️ Rule-Profile Comparison — your identical edge run against six different rule sets side by side, showing target, daily limit, maximum drawdown and the resulting pass probability, with your own rules marked. Profiles are labelled by their actual numbers and drawdown type rather than by brand, because firm terms change and the rules are what the maths responds to. The same trader can be comfortably profitable under one rule set and mathematically doomed under another — this makes that visible before you choose.
🔥 Sensitivity Grid — an optional 5×5 heat grid re-running the simulation across a range of win rates and reward:risk ratios around your inputs, colour-graded by pass probability with your base case marked. It shows how fragile or robust your pass odds are: whether you sit on a plateau where a small slip still passes, or on a cliff edge where two points of win rate is the difference between funded and refunded.
✅ Readiness Checklist — the pre-flight audit, scored out of eight, every box ✓ before you pay: the edge is positive after costs, the sample behind your numbers is at least 100 trades, risk sits at or below half-Kelly, pass probability clears 50%, the worst loss streak is survivable inside the maximum drawdown, spread and slippage are actually modelled, execution rate is at least 85%, and the average drawdown per run stays inside the limit. Each item shows the value it was judged on, so a ✗ tells you exactly what to fix.
📊 Two-Panel Dashboard — the read-out is split into two panels so it fits on a normal screen. Panel A — Results carries the verdict with a pass-probability bar and a plain-language rating, the full failure breakdown by cause, time to pass as median / fastest 10% / average / slowest 10% with the average ending balance and net P/L, the loss-streak anchor, day extremes (average up day, average down day, gain/loss ratio, best and worst day), and your setup summary. Panel B — Edge & Economics carries edge analytics, execution reality, challenge economics, and the readiness checklist. Both panels, the calendar, the comparison and the grid can each be placed in any of nine screen slots at three text sizes, so nothing overlaps whatever else you run.
🎚️ Discipline & Behaviour Controls — rules you impose on yourself, tested rather than assumed. A daily profit lock stops the day after +X R; a circuit breaker stops it after −Y R. Tilt / revenge sizing models the classic killer: after a chosen number of consecutive losses, risk is multiplied — switch it on and watch the daily-loss failure rate climb. The consistency rule caps how much of total profit a single day may carry and voids passes that breach it, exactly as firms do. Variable R randomises win and loss sizes around your averages for extra realism.
🔔 Alerts — fires on a positive edge (expectancy above 0R after costs) and on a negative edge, the latter being the one that matters: it means the challenge maths does not work at your current inputs, regardless of how the curves happen to look.
🔧 Fully Customizable — every component is exposed: account size, currency symbol and phase; both profit targets, daily and maximum drawdown, drawdown type, minimum days, deadline, and the consistency rule with its threshold; win rate, reward:risk, average loss in R, risk basis (current equity / starting balance / fixed amount), risk size, trades per day, and the sample size behind your numbers; spread and slippage in R, execution rate, off-rule win rate, and tilt with its trigger and multiplier; the profit lock and circuit breaker; fee, refund, split, payout percentage and payout count; simulation count, seed, and R randomisation; curve count, curve width, reference lines and balance labels; and every panel, module, position and text size.
🎯 Why this is different — a pass-probability calculator gives you one number from a formula and stops. This runs the entire evaluation thousands of times under the firm's real rule stack, tells you not just whether you pass but precisely what kills you when you don't, charges you for spread and for the trades you don't take properly, hands you the loss streak you must be able to sit through, prices the attempt in expected value rather than hope, checks your readiness against eight objective boxes, and draws the whole thing as honest equity curves where every stop-out is counted. It is built to talk you out of a bad challenge, not into one.
🚀 Where to use it — the simulator is symbol- and timeframe-agnostic: it models your trading edge and your firm's rules, not the chart it sits on, so you can leave it on any instrument on any timeframe and the answer is the same. Load the chart you actually intend to trade for context, feed it the win rate and reward:risk from your own backtest or journal on that market, and set the rule inputs to your specific target firm — different firms' rules produce materially different answers from the identical edge.
🎯 How to use it
Enter your firm's rules exactly — target, daily limit, maximum drawdown, and above all the correct drawdown type, since Static, Trailing and Trailing → Lock are not interchangeable.
Enter your real edge from a real sample — win rate, reward:risk, average loss in R, risk per trade and trades per day — and set the sample size honestly. Under 100 trades, the checklist will flag your numbers as statistically meaningless, and it is right.
Set the execution reality before you believe anything — put your true spread and slippage in R, and set your execution rate to what you actually achieve, not what you intend. Watch Backtest WR → Real WR.
Read the verdict, then read why runs fail — the failure breakdown tells you what to fix. Daily-limit failures mean size or tilt; max-drawdown failures mean the edge or the risk; timeouts mean the target is out of reach in the time allowed.
Check the loss-streak anchor and the checklist before the pass probability — a 99% pass probability with an unsurvivable worst streak is a tail risk, not a green light.
Price it in Panel B — if the net expected value is negative, the challenge is a bad purchase however good the odds look.
Tune risk with the Kelly verdict and the sensitivity grid, and re-check the calendar for consistency-rule exposure if your firm enforces one.
⚠️ Important — this is a planning and decision-support tool, not a trading system, and it makes no performance guarantees. Every output is a probabilistic estimate derived entirely from the inputs you provide: the simulation cannot know your real edge, and garbage in is garbage out with three decimal places. Real markets are not independent coin flips — they cluster, trend, gap and change regime, while the model assumes each trade is an independent draw from your stated win rate, so treat the results as the mathematical shape of your challenge rather than a forecast of it. Pass probability is the headline and the least useful number on its own; weigh it against the failure breakdown, the loss-streak anchor, average drawdown and expected value. Rule sets vary between firms and change over time — verify every rule against your firm's current terms, particularly the drawdown type and any consistency requirement. No simulation, however honest, is a substitute for a tested edge and your own risk management.
Açık kaynak kodlu komut dosyası
Gerçek TradingView ruhuyla, bu komut dosyasının mimarı, yatırımcıların işlevselliğini inceleyip doğrulayabilmesi için onu açık kaynaklı hale getirdi. Yazarı tebrik ederiz! Ücretsiz olarak kullanabilseniz de, kodu yeniden yayınlamanın Topluluk Kurallarımıza tabi olduğunu unutmayın.

syndicate001.com
Algo systems for prop traders
Algo systems for pro gold traders
Algo Trading and Indicator Tutorials
Levels desk Gold FX NQ ES JPN225
telegram.me/aisyndicate001
Algo systems for prop traders
Algo systems for pro gold traders
Algo Trading and Indicator Tutorials
Levels desk Gold FX NQ ES JPN225
telegram.me/aisyndicate001
Feragatname
Bilgiler ve yayınlar, TradingView tarafından sağlanan veya onaylanan finansal, yatırım, alım satım veya diğer türden tavsiye veya öneriler anlamına gelmez ve teşkil etmez. Kullanım Koşulları bölümünde daha fazlasını okuyun.
Açık kaynak kodlu komut dosyası
Gerçek TradingView ruhuyla, bu komut dosyasının mimarı, yatırımcıların işlevselliğini inceleyip doğrulayabilmesi için onu açık kaynaklı hale getirdi. Yazarı tebrik ederiz! Ücretsiz olarak kullanabilseniz de, kodu yeniden yayınlamanın Topluluk Kurallarımıza tabi olduğunu unutmayın.
syndicate001.com
Algo systems for prop traders
Algo systems for pro gold traders
Algo Trading and Indicator Tutorials
Levels desk Gold FX NQ ES JPN225
telegram.me/aisyndicate001
Algo systems for prop traders
Algo systems for pro gold traders
Algo Trading and Indicator Tutorials
Levels desk Gold FX NQ ES JPN225
telegram.me/aisyndicate001
Feragatname
Bilgiler ve yayınlar, TradingView tarafından sağlanan veya onaylanan finansal, yatırım, alım satım veya diğer türden tavsiye veya öneriler anlamına gelmez ve teşkil etmez. Kullanım Koşulları bölümünde daha fazlasını okuyun.