PINE LIBRARY
Güncellendi MonthlyPerformanceV2
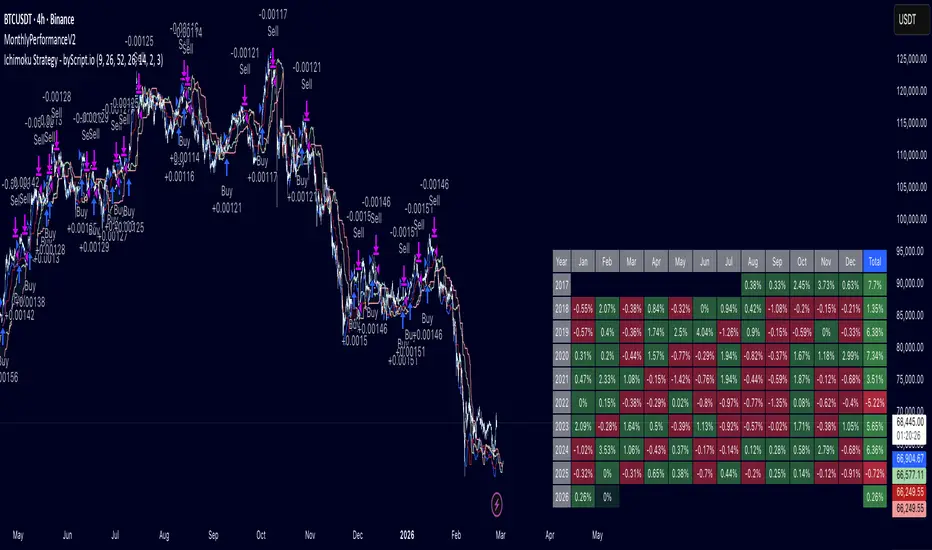
This library provides a plug-and-play monthly performance table for strategy scripts.
It automatically tracks and displays profit/loss per month and year directly on your chart.
─────────────────────────────────────
🔧 FUNCTION
─────────────────────────────────────
trackAndDraw(initialCapital, showInPercentage)
Parameters:
- initialCapital (float) — The starting capital of your strategy.
Tip: use `strategy.initial_capital` for automatic sync.
- showInPercentage (bool) — Display mode:
`true` → shows monthly result in % (compounding)
`false` → shows monthly result in USD (normalized to initial capital)
─────────────────────────────────────
📊 FEATURES
─────────────────────────────────────
- Compounding % calculation per month and per year
- Dual display mode: percentage or USD equivalent
- Color-coded cells (green / red) for quick visual reading
- Running month tracker (current open month, lighter color)
- Annual total column with compounding yearly return
- Auto-limits display to the 19 most recent years to prevent table overflow
─────────────────────────────────────
🚀 HOW TO USE
─────────────────────────────────────
add this 2 lines code to your script
import edwinardyanto/MonthlyPerformance/1 as mp
mp.trackAndDraw(strategy.initial_capital, true)
─────────────────────────────────────
📌 NOTES
─────────────────────────────────────
- Only compatible with strategy scripts (requires strategy.equity)
- Call trackAndDraw() once, outside any conditional block
- Table is displayed at bottom-right of the chart
- Older years beyond the 19-year limit are excluded from display
but still calculated internally
It automatically tracks and displays profit/loss per month and year directly on your chart.
─────────────────────────────────────
🔧 FUNCTION
─────────────────────────────────────
trackAndDraw(initialCapital, showInPercentage)
Parameters:
- initialCapital (float) — The starting capital of your strategy.
Tip: use `strategy.initial_capital` for automatic sync.
- showInPercentage (bool) — Display mode:
`true` → shows monthly result in % (compounding)
`false` → shows monthly result in USD (normalized to initial capital)
─────────────────────────────────────
📊 FEATURES
─────────────────────────────────────
- Compounding % calculation per month and per year
- Dual display mode: percentage or USD equivalent
- Color-coded cells (green / red) for quick visual reading
- Running month tracker (current open month, lighter color)
- Annual total column with compounding yearly return
- Auto-limits display to the 19 most recent years to prevent table overflow
─────────────────────────────────────
🚀 HOW TO USE
─────────────────────────────────────
add this 2 lines code to your script
import edwinardyanto/MonthlyPerformance/1 as mp
mp.trackAndDraw(strategy.initial_capital, true)
─────────────────────────────────────
📌 NOTES
─────────────────────────────────────
- Only compatible with strategy scripts (requires strategy.equity)
- Call trackAndDraw() once, outside any conditional block
- Table is displayed at bottom-right of the chart
- Older years beyond the 19-year limit are excluded from display
but still calculated internally
Sürüm Notları
v2better visual
Pine kitaplığı
Gerçek TradingView ruhuyla, yazar bu Pine kodunu açık kaynaklı bir kütüphane olarak yayınladı, böylece topluluğumuzdaki diğer Pine programcıları onu yeniden kullanabilir. Yazarı tebrik ederiz! Bu kütüphaneyi özel olarak veya diğer açık kaynaklı yayınlarda kullanabilirsiniz, ancak bu kodun yayınlarda yeniden kullanılması Topluluk Kuralları tarafından yönetilir.

Feragatname
Bilgiler ve yayınlar, TradingView tarafından sağlanan veya onaylanan finansal, yatırım, alım satım veya diğer türden tavsiye veya öneriler anlamına gelmez ve teşkil etmez. Kullanım Koşulları bölümünde daha fazlasını okuyun.
Pine kitaplığı
Gerçek TradingView ruhuyla, yazar bu Pine kodunu açık kaynaklı bir kütüphane olarak yayınladı, böylece topluluğumuzdaki diğer Pine programcıları onu yeniden kullanabilir. Yazarı tebrik ederiz! Bu kütüphaneyi özel olarak veya diğer açık kaynaklı yayınlarda kullanabilirsiniz, ancak bu kodun yayınlarda yeniden kullanılması Topluluk Kuralları tarafından yönetilir.
Feragatname
Bilgiler ve yayınlar, TradingView tarafından sağlanan veya onaylanan finansal, yatırım, alım satım veya diğer türden tavsiye veya öneriler anlamına gelmez ve teşkil etmez. Kullanım Koşulları bölümünde daha fazlasını okuyun.