OPEN-SOURCE SCRIPT
Güncellendi Big Trades Whale Detector [Volume Anomalies] By HK
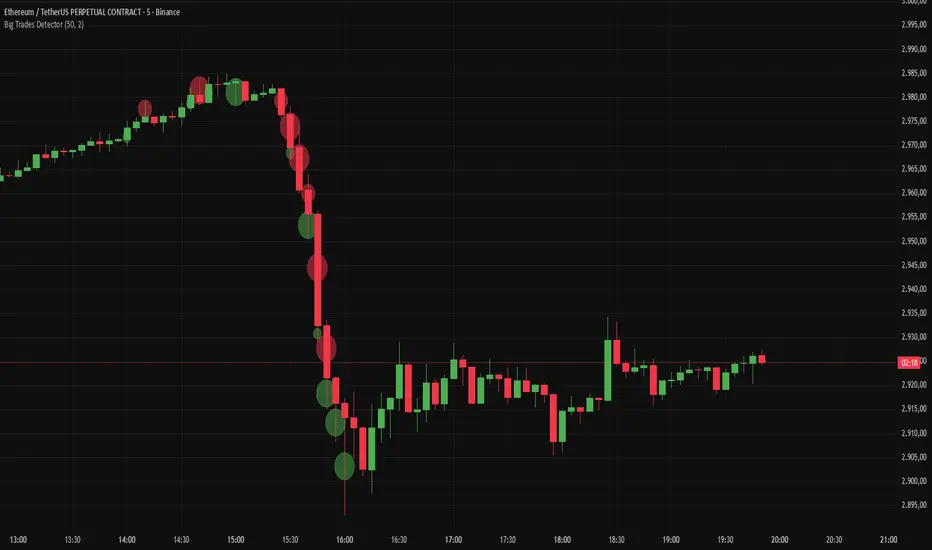
Overview The "Big Trade Detector" helps you spot institutional footprints by identifying volume anomalies that act as outliers compared to recent history. It uses statistical analysis (Standard Deviation) to filter out noise and highlight only significant buying or selling pressure.
Features:
Volume Decomposition: Approximates buy/sell volume based on price action within the candle (Close vs. Range).
3-Tier Detection: Uses dynamic thresholds to categorize volume spikes into Small, Medium, and Extreme events.
Smart Calculation: Compares current volume against the previous average to detect sudden shifts in momentum.
Visuals:
Green Circles (Below Bar): Unusual Buying Pressure (Support defense or Breakout).
Red Circles (Above Bar): Unusual Selling Pressure (Resistance defense or Dump).
Size Matters: The larger the circle, the higher the standard deviation (Sigma) of that volume event.
Features:
Volume Decomposition: Approximates buy/sell volume based on price action within the candle (Close vs. Range).
3-Tier Detection: Uses dynamic thresholds to categorize volume spikes into Small, Medium, and Extreme events.
Smart Calculation: Compares current volume against the previous average to detect sudden shifts in momentum.
Visuals:
Green Circles (Below Bar): Unusual Buying Pressure (Support defense or Breakout).
Red Circles (Above Bar): Unusual Selling Pressure (Resistance defense or Dump).
Size Matters: The larger the circle, the higher the standard deviation (Sigma) of that volume event.
Sürüm Notları
Overview The "Big Trade Detector" helps you spot institutional footprints by identifying volume anomalies that act as outliers compared to recent history. It uses statistical analysis (Standard Deviation) to filter out noise and highlight only significant buying or selling pressure.Features:
Volume Decomposition: Approximates buy/sell volume based on price action within the candle (Close vs. Range).
3-Tier Detection: Uses dynamic thresholds to categorize volume spikes into Small, Medium, and Extreme events.
Smart Calculation: Compares current volume against the previous average to detect sudden shifts in momentum.
Visuals:
Green Circles (Below Bar): Unusual Buying Pressure (Support defense or Breakout).
Red Circles (Above Bar): Unusual Selling Pressure (Resistance defense or Dump).
Size Matters: The larger the circle, the higher the standard deviation (Sigma) of that volume event.
Sürüm Notları
Changes:Updated to Pine Script v6.
Improved Visuals: Big Trade circles are no longer floating above/below bars. They are now plotted at absolute price levels to better reflect where the volume activity occurred within the candle.
Buys: Plotted at the average of Low and Close.
Sells: Plotted at the average of High and Close.
Sürüm Notları
Big Update!How it works:
Intrabar Precision: The script inspects the candle using lower timeframe data (default: 5-second ticks) to find exactly where the volume occurred.
Volume Filtering: It filters out noise and only plots bubbles when a specific volume threshold (Minimum Volume) is hit within that 5-second window.
Smart Coloring: Bubbles are colored Green (Buy) or Red (Sell) based on the price action within that specific micro-movement.
⚙️ Settings:
Minimum Volume: Set the threshold for big trades (e.g., 150+ for ETH, higher for BTC).
Circle Size: Controls the background bubble.
Font Size: Controls the text readability independently.
⚠️ Important Visual Tip: If the text appears "behind" the candles or disappears:
Right-click any of the indicator Volume Text/Bubbles.
Select Visual Order -> Bring to Front. (This is a standard TradingView setting to ensure labels stay on top of price bars).
Sürüm Notları
I have reverted the last Update to the original code without premium features.Sürüm Notları
Buy/sell dots enlarged for better visibility, and default Transparency set to 50%Açık kaynak kodlu komut dosyası
Gerçek TradingView ruhuyla, bu komut dosyasının mimarı, yatırımcıların işlevselliğini inceleyip doğrulayabilmesi için onu açık kaynaklı hale getirdi. Yazarı tebrik ederiz! Ücretsiz olarak kullanabilseniz de, kodu yeniden yayınlamanın Topluluk Kurallarımıza tabi olduğunu unutmayın.

Feragatname
Bilgiler ve yayınlar, TradingView tarafından sağlanan veya onaylanan finansal, yatırım, alım satım veya diğer türden tavsiye veya öneriler anlamına gelmez ve teşkil etmez. Kullanım Koşulları bölümünde daha fazlasını okuyun.
Açık kaynak kodlu komut dosyası
Gerçek TradingView ruhuyla, bu komut dosyasının mimarı, yatırımcıların işlevselliğini inceleyip doğrulayabilmesi için onu açık kaynaklı hale getirdi. Yazarı tebrik ederiz! Ücretsiz olarak kullanabilseniz de, kodu yeniden yayınlamanın Topluluk Kurallarımıza tabi olduğunu unutmayın.
Feragatname
Bilgiler ve yayınlar, TradingView tarafından sağlanan veya onaylanan finansal, yatırım, alım satım veya diğer türden tavsiye veya öneriler anlamına gelmez ve teşkil etmez. Kullanım Koşulları bölümünde daha fazlasını okuyun.