Rolling KPSS Statistic [LuxAlgo]
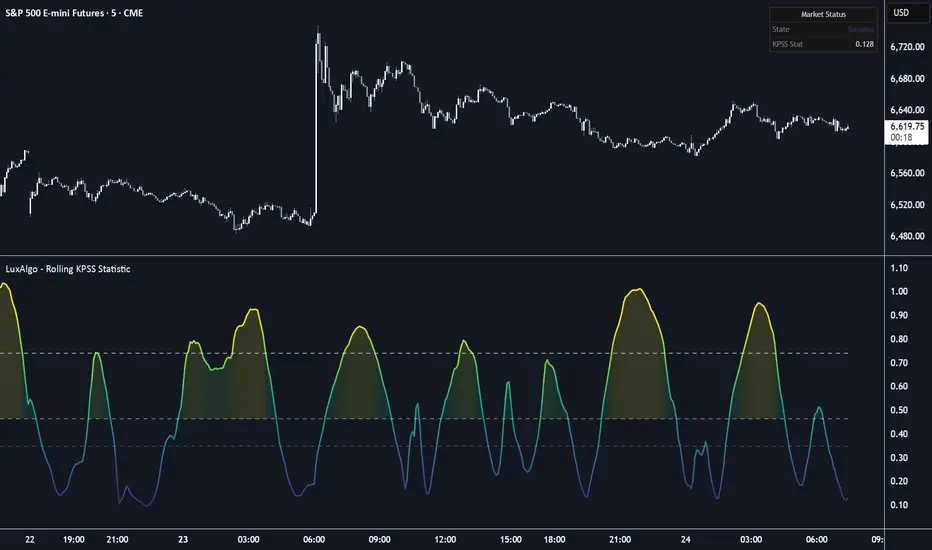
The Rolling KPSS Statistic indicator evaluates the stationarity of price action within a rolling window using the Kwiatkowski-Phillips-Schmidt-Shin (KPSS) test. This tool helps traders identify whether the current market environment is ranging, trending, or undergoing a structural regime shift by providing a continuous statistical measure of mean reversion.
🔶 USAGE
The indicator is designed to distinguish between stationary price action (where price fluctuates around a mean or trend) and non-stationary price action (where price exhibits random walk or breakout behavior). By applying a rolling window calculation, it provides a real-time assessment of market stability.
The script offers two primary modes of operation tailored to different market conditions:
🔹 Level Mode
This mode tests for stationarity around a constant mean. It is the optimal setting for detecting ranging or mean-reverting environments. When the KPSS statistic is low in this mode, it suggests the market is staying within a defined horizontal corridor.
🔹 Trend Mode
This mode tests for stationarity around a linear trend. It is used to identify if the market is moving consistently within a trending channel. A low KPSS value here indicates that while the price is moving up or down, it is doing so in a mathematically stable "stationary" trend rather than an erratic or parabolic one.
🔶 DETAILS
The KPSS test operates on the null hypothesis that the series is stationary. Unlike other unit root tests (like the Augmented Dickey-Fuller test), a low value in KPSS indicates stationarity, while a high value suggests the presence of a unit root (non-stationarity).
🔹 Critical Levels
The indicator plots three significance thresholds: 10%, 5%, and 1%.
🔹 Visual Feedback
The indicator uses a Viridis gradient theme. Brighter colors (yellow/green) represent stationary, mean-reverting behavior, while darker colors (purple/blue) represent non-stationary or trending behavior. A real-time dashboard is also included to provide an immediate summary of the current market state.
🔶 SETTINGS
🔹 Main Settings
🔹 Visuals & Dashboard
🔶 USAGE
The indicator is designed to distinguish between stationary price action (where price fluctuates around a mean or trend) and non-stationary price action (where price exhibits random walk or breakout behavior). By applying a rolling window calculation, it provides a real-time assessment of market stability.
The script offers two primary modes of operation tailored to different market conditions:
🔹 Level Mode
This mode tests for stationarity around a constant mean. It is the optimal setting for detecting ranging or mean-reverting environments. When the KPSS statistic is low in this mode, it suggests the market is staying within a defined horizontal corridor.
🔹 Trend Mode
This mode tests for stationarity around a linear trend. It is used to identify if the market is moving consistently within a trending channel. A low KPSS value here indicates that while the price is moving up or down, it is doing so in a mathematically stable "stationary" trend rather than an erratic or parabolic one.
🔶 DETAILS
The KPSS test operates on the null hypothesis that the series is stationary. Unlike other unit root tests (like the Augmented Dickey-Fuller test), a low value in KPSS indicates stationarity, while a high value suggests the presence of a unit root (non-stationarity).
🔹 Critical Levels
The indicator plots three significance thresholds: 10%, 5%, and 1%.
- KPSS < 5% Level: The market is considered stationary. In "Level" mode, this implies a Range. In "Trend" mode, this implies a stable Trend.
- KPSS > 5% Level: The null hypothesis is rejected. The market is "Non-Stationary," suggesting a breakout, a trend reversal, or a transition into a random walk state.
- KPSS > 1% Level: This indicates a highly significant deviation from stationarity, often seen during impulsive market expansions.
🔹 Visual Feedback
The indicator uses a Viridis gradient theme. Brighter colors (yellow/green) represent stationary, mean-reverting behavior, while darker colors (purple/blue) represent non-stationary or trending behavior. A real-time dashboard is also included to provide an immediate summary of the current market state.
🔶 SETTINGS
🔹 Main Settings
- Window Length: The number of bars used for the rolling window. The default of 100 provides a balanced statistical lookback for most timeframes.
- Source: The price data used for the calculation (default is Close).
- Test Type: Select between "Level" (for ranges) or "Trend" (for trending stationarity).
- Newey-West Bandwidth: A lag truncation parameter used to account for serial correlation in the residuals.
🔹 Visuals & Dashboard
- Show Critical Levels: Toggles the visibility of the 10%, 5%, and 1% dashed lines.
- Dashboard: Enables or disables the on-screen information table.
- Position/Size: Controls the location and scale of the dashboard on the chart.

All content & scripts provided by LuxAlgo are for educational purposes only and are not financial advice.
Feragatname
Bilgiler ve yayınlar, TradingView tarafından sağlanan veya onaylanan finansal, yatırım, alım satım veya diğer türden tavsiye veya öneriler anlamına gelmez ve teşkil etmez. Kullanım Koşulları bölümünde daha fazlasını okuyun.
Feragatname
Bilgiler ve yayınlar, TradingView tarafından sağlanan veya onaylanan finansal, yatırım, alım satım veya diğer türden tavsiye veya öneriler anlamına gelmez ve teşkil etmez. Kullanım Koşulları bölümünde daha fazlasını okuyun.