OPEN-SOURCE SCRIPT
S&P 500 Put/Call Skew Proxy (CBOE SKEW)
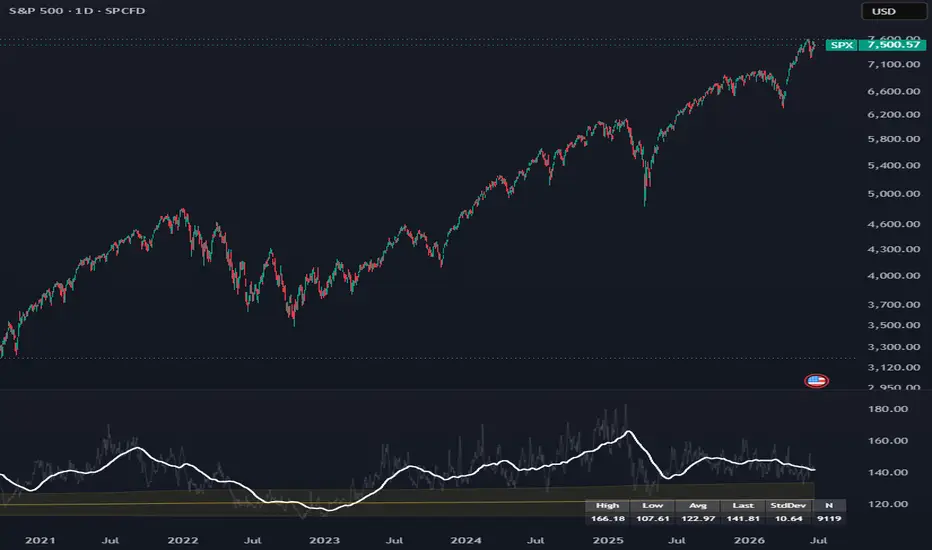
S&P 500 Put/Call Skew Proxy (CBOE SKEW)
A proxy for the average single-stock put/call skew across S&P 500 constituents, built on the CBOE SKEW Index. Inspired by Goldman Sachs research charting the 3-month normalized put/call skew for individual S&P 500 stocks, which requires constituent-level options surface data unavailable on TradingView.
What is the CBOE SKEW Index?
The CBOE SKEW Index measures the perceived tail risk in S&P 500 index options. It quantifies the price of insuring against outsized downside moves by comparing the implied volatility of out-of-the-money puts to at-the-money options. Higher values indicate greater demand for tail-risk protection; lower values signal complacency or reduced hedging activity.
While the GS metric averages skew across individual stock options surfaces, the CBOE SKEW captures a related signal at the index level: how aggressively the market is pricing left-tail risk. Both compress toward historical lows during periods of broad complacency and spike during stress events.
How This Indicator Works
Pulls CBOE:SKEW and applies a 63-bar simple moving average (approximately 3 months of trading days) as the primary signal, matching the smoothing window of the GS chart.
Optionally displays the raw (unsmoothed) SKEW as a dimmed background line for context.
Computes full-history summary statistics: high, low, mean, last, and standard deviation of the smoothed series.
Plots the historical mean and ±1 standard deviation bands to identify extremes.
Displays a summary statistics table (High, Low, Avg, Last, StdDev, N) in the style of the original GS chart.
Interpretation
Readings near or above the upper standard deviation band suggest unusually high demand for downside protection, historically associated with market stress, fear of tail-risk events, or elevated hedging activity.
Readings near or below the lower band indicate reduced demand for crash insurance, historically associated with complacency or euphoria.
Sustained compression toward the lower bound has preceded several notable market corrections, though the signal is not directionally predictive on its own.
Limitations
This is a proxy, not a replication. The CBOE SKEW measures index-level tail-risk pricing, not the average of individual stock option skews. The two are correlated but not identical.
Structural changes in options markets (growth of 0DTE, systematic call-overwriting strategies, dealer hedging flows) may compress skew for reasons unrelated to sentiment.
Best used as a supporting input within a broader market breadth or sentiment framework, not as a standalone signal.
Settings
Smoothing Length: default 63 (3 months). Adjustable for shorter or longer signal windows.
Show Raw SKEW: toggle the unsmoothed series on/off.
Show Mean ± StdDev Bands: toggle statistical reference lines.
Show Summary Statistics Table: toggle the stats table and select its position.
A proxy for the average single-stock put/call skew across S&P 500 constituents, built on the CBOE SKEW Index. Inspired by Goldman Sachs research charting the 3-month normalized put/call skew for individual S&P 500 stocks, which requires constituent-level options surface data unavailable on TradingView.
What is the CBOE SKEW Index?
The CBOE SKEW Index measures the perceived tail risk in S&P 500 index options. It quantifies the price of insuring against outsized downside moves by comparing the implied volatility of out-of-the-money puts to at-the-money options. Higher values indicate greater demand for tail-risk protection; lower values signal complacency or reduced hedging activity.
While the GS metric averages skew across individual stock options surfaces, the CBOE SKEW captures a related signal at the index level: how aggressively the market is pricing left-tail risk. Both compress toward historical lows during periods of broad complacency and spike during stress events.
How This Indicator Works
Pulls CBOE:SKEW and applies a 63-bar simple moving average (approximately 3 months of trading days) as the primary signal, matching the smoothing window of the GS chart.
Optionally displays the raw (unsmoothed) SKEW as a dimmed background line for context.
Computes full-history summary statistics: high, low, mean, last, and standard deviation of the smoothed series.
Plots the historical mean and ±1 standard deviation bands to identify extremes.
Displays a summary statistics table (High, Low, Avg, Last, StdDev, N) in the style of the original GS chart.
Interpretation
Readings near or above the upper standard deviation band suggest unusually high demand for downside protection, historically associated with market stress, fear of tail-risk events, or elevated hedging activity.
Readings near or below the lower band indicate reduced demand for crash insurance, historically associated with complacency or euphoria.
Sustained compression toward the lower bound has preceded several notable market corrections, though the signal is not directionally predictive on its own.
Limitations
This is a proxy, not a replication. The CBOE SKEW measures index-level tail-risk pricing, not the average of individual stock option skews. The two are correlated but not identical.
Structural changes in options markets (growth of 0DTE, systematic call-overwriting strategies, dealer hedging flows) may compress skew for reasons unrelated to sentiment.
Best used as a supporting input within a broader market breadth or sentiment framework, not as a standalone signal.
Settings
Smoothing Length: default 63 (3 months). Adjustable for shorter or longer signal windows.
Show Raw SKEW: toggle the unsmoothed series on/off.
Show Mean ± StdDev Bands: toggle statistical reference lines.
Show Summary Statistics Table: toggle the stats table and select its position.
Açık kaynak kodlu komut dosyası
Gerçek TradingView ruhuyla, bu komut dosyasının mimarı, yatırımcıların işlevselliğini inceleyip doğrulayabilmesi için onu açık kaynaklı hale getirdi. Yazarı tebrik ederiz! Ücretsiz olarak kullanabilseniz de, kodu yeniden yayınlamanın Topluluk Kurallarımıza tabi olduğunu unutmayın.

Feragatname
Bilgiler ve yayınlar, TradingView tarafından sağlanan veya onaylanan finansal, yatırım, alım satım veya diğer türden tavsiye veya öneriler anlamına gelmez ve teşkil etmez. Kullanım Koşulları bölümünde daha fazlasını okuyun.
Açık kaynak kodlu komut dosyası
Gerçek TradingView ruhuyla, bu komut dosyasının mimarı, yatırımcıların işlevselliğini inceleyip doğrulayabilmesi için onu açık kaynaklı hale getirdi. Yazarı tebrik ederiz! Ücretsiz olarak kullanabilseniz de, kodu yeniden yayınlamanın Topluluk Kurallarımıza tabi olduğunu unutmayın.
Feragatname
Bilgiler ve yayınlar, TradingView tarafından sağlanan veya onaylanan finansal, yatırım, alım satım veya diğer türden tavsiye veya öneriler anlamına gelmez ve teşkil etmez. Kullanım Koşulları bölümünde daha fazlasını okuyun.