OPEN-SOURCE SCRIPT
Smart Money Liquidity Matrix & Session Finder
==============================================================================================
SMART MONEY LIQUIDITY MATRIX & SESSION FINDER [SMC PRO]
==============================================================================================
OVERVIEW
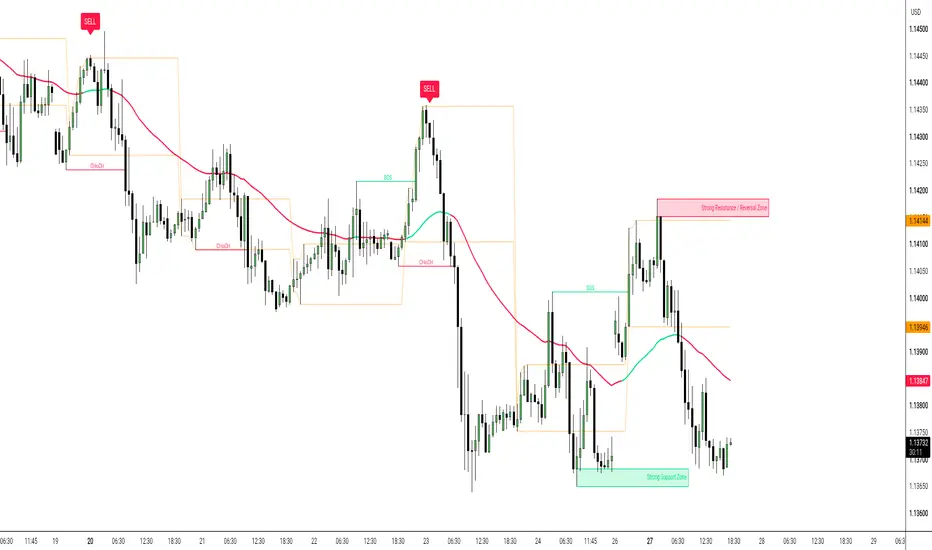
The Smart Money Liquidity Matrix & Session Finder is a lightweight, high-precision technical mapping indicator designed to help traders analyze market structure, session ranges, and key supply/demand areas in real time.
By combining smooth higher-timeframe trend directional bias, automated swing structure breaks, and session liquidity windows, this tool provides a clean, clutter-free environment for contextual chart analysis.
KEY TECHNICAL FEATURES
1. ASIAN SESSION RANGE & TIMING ENGINE
• Automatically tracks and marks the Asian Range boundaries (default: 20:00–00:00 NY time).
• Defines a clear trading session execution window (default: 00:00–03:00 NY time) to analyze session breakouts and liquidity sweeps.
2. DYNAMIC SMOOTHED TREND DIRECTION
• Utilizes a double-smoothed moving average filter to plot a clean, adaptive trend line.
• Eliminates false color flips during minor pullbacks, staying Green during bullish momentum and Red during bearish trends.
3. STRUCTURE BREAK MAPPING (BOS & CHoCH)
• Automatically identifies major market structure pivots and plots clean horizontal level lines.
• Features centered text labels for Break of Structure (BOS) and Change of Character (CHoCH) to maintain clean horizontal visualization.
4. BREAKER BLOCK STYLE ZONES
• Maps key dynamic Support and Resistance areas directly around pivot wicks and bodies.
• Features clean, right-aligned inside box text labels identifying major Reversal and Support/Resistance boundaries.
INDICATOR SETTINGS & INPUTS EXPLAINED
1. SESSION & TIMEZONE SETTINGS
• NY Timezone: Configures the base exchange time standard for accurate session calculation.
• Range Window: Defines the exact session hours used to calculate initial liquidity range high/low.
• Trade Window: Sets the active session hours where breakout evaluation is active.
2. SIGNAL & ENTRY CONFIGURATION
• Show Buy / Sell Signals: Toggle display for session breakout and FVG confirmation labels.
• Only 1 Trade Per Day: Limits signal generation to a single daily execution setup to prevent over-analysis.
• Signal Padding: Adjusts the vertical offset (in ticks) for signal labels relative to candle highs/lows.
3. MAJOR SMOOTH TREND LINE
• Smooth Trend Length: Adjusts the baseline length of the trend-following moving average (Higher values smooth out short-term market noise).
4. PROFESSIONAL STRUCTURE (BOS / CHoCH)
• Major Swing Sensitivity: Controls pivot lookback period for detecting major structural breaks (Higher values focus only on higher-timeframe swings).
5. BREAKER BLOCK ZONES
• Zone Sensitivity: Controls the lookback depth for active Support and Resistance breaker zones.
HOW TO USE IN YOUR ANALYSIS
• Trend Bias: Use the smooth dynamic trend line to align your trades with the primary market direction
(Green = Bullish Bias, Red = Bearish Bias).
• Session Liquidity: Observe price behavior relative to the Asian Session High/Low levels during the active trade window.
• Breaker Zones: Dynamic Resistance boxes indicate potential supply/reversal areas, while Support boxes highlight potential demand/bounce levels.
• Structure Confirmation: Use BOS and CHoCH signals to confirm structural trend continuations or shifts.
DISCLAIMER
This technical indicator is provided strictly for educational and chart analysis purposes. It does not constitute financial or investment advice. Past performance is not indicative of future results. Always manage risk responsibly.
==============================================================================================
SMART MONEY LIQUIDITY MATRIX & SESSION FINDER [SMC PRO]
==============================================================================================
OVERVIEW
The Smart Money Liquidity Matrix & Session Finder is a lightweight, high-precision technical mapping indicator designed to help traders analyze market structure, session ranges, and key supply/demand areas in real time.
By combining smooth higher-timeframe trend directional bias, automated swing structure breaks, and session liquidity windows, this tool provides a clean, clutter-free environment for contextual chart analysis.
KEY TECHNICAL FEATURES
1. ASIAN SESSION RANGE & TIMING ENGINE
• Automatically tracks and marks the Asian Range boundaries (default: 20:00–00:00 NY time).
• Defines a clear trading session execution window (default: 00:00–03:00 NY time) to analyze session breakouts and liquidity sweeps.
2. DYNAMIC SMOOTHED TREND DIRECTION
• Utilizes a double-smoothed moving average filter to plot a clean, adaptive trend line.
• Eliminates false color flips during minor pullbacks, staying Green during bullish momentum and Red during bearish trends.
3. STRUCTURE BREAK MAPPING (BOS & CHoCH)
• Automatically identifies major market structure pivots and plots clean horizontal level lines.
• Features centered text labels for Break of Structure (BOS) and Change of Character (CHoCH) to maintain clean horizontal visualization.
4. BREAKER BLOCK STYLE ZONES
• Maps key dynamic Support and Resistance areas directly around pivot wicks and bodies.
• Features clean, right-aligned inside box text labels identifying major Reversal and Support/Resistance boundaries.
INDICATOR SETTINGS & INPUTS EXPLAINED
1. SESSION & TIMEZONE SETTINGS
• NY Timezone: Configures the base exchange time standard for accurate session calculation.
• Range Window: Defines the exact session hours used to calculate initial liquidity range high/low.
• Trade Window: Sets the active session hours where breakout evaluation is active.
2. SIGNAL & ENTRY CONFIGURATION
• Show Buy / Sell Signals: Toggle display for session breakout and FVG confirmation labels.
• Only 1 Trade Per Day: Limits signal generation to a single daily execution setup to prevent over-analysis.
• Signal Padding: Adjusts the vertical offset (in ticks) for signal labels relative to candle highs/lows.
3. MAJOR SMOOTH TREND LINE
• Smooth Trend Length: Adjusts the baseline length of the trend-following moving average (Higher values smooth out short-term market noise).
4. PROFESSIONAL STRUCTURE (BOS / CHoCH)
• Major Swing Sensitivity: Controls pivot lookback period for detecting major structural breaks (Higher values focus only on higher-timeframe swings).
5. BREAKER BLOCK ZONES
• Zone Sensitivity: Controls the lookback depth for active Support and Resistance breaker zones.
HOW TO USE IN YOUR ANALYSIS
• Trend Bias: Use the smooth dynamic trend line to align your trades with the primary market direction
(Green = Bullish Bias, Red = Bearish Bias).
• Session Liquidity: Observe price behavior relative to the Asian Session High/Low levels during the active trade window.
• Breaker Zones: Dynamic Resistance boxes indicate potential supply/reversal areas, while Support boxes highlight potential demand/bounce levels.
• Structure Confirmation: Use BOS and CHoCH signals to confirm structural trend continuations or shifts.
DISCLAIMER
This technical indicator is provided strictly for educational and chart analysis purposes. It does not constitute financial or investment advice. Past performance is not indicative of future results. Always manage risk responsibly.
==============================================================================================
Açık kaynak kodlu komut dosyası
Gerçek TradingView ruhuyla, bu komut dosyasının mimarı, yatırımcıların işlevselliğini inceleyip doğrulayabilmesi için onu açık kaynaklı hale getirdi. Yazarı tebrik ederiz! Ücretsiz olarak kullanabilseniz de, kodu yeniden yayınlamanın Topluluk Kurallarımıza tabi olduğunu unutmayın.

Feragatname
Bilgiler ve yayınlar, TradingView tarafından sağlanan veya onaylanan finansal, yatırım, alım satım veya diğer türden tavsiye veya öneriler anlamına gelmez ve teşkil etmez. Kullanım Koşulları bölümünde daha fazlasını okuyun.
Açık kaynak kodlu komut dosyası
Gerçek TradingView ruhuyla, bu komut dosyasının mimarı, yatırımcıların işlevselliğini inceleyip doğrulayabilmesi için onu açık kaynaklı hale getirdi. Yazarı tebrik ederiz! Ücretsiz olarak kullanabilseniz de, kodu yeniden yayınlamanın Topluluk Kurallarımıza tabi olduğunu unutmayın.
Feragatname
Bilgiler ve yayınlar, TradingView tarafından sağlanan veya onaylanan finansal, yatırım, alım satım veya diğer türden tavsiye veya öneriler anlamına gelmez ve teşkil etmez. Kullanım Koşulları bölümünde daha fazlasını okuyun.