Stockbee Anticipation Setup
STOCKBEE ANTICIPATION SETUP
Finds stocks that have already run, then gone quiet — tight range, drying volume, holding near the highs of a small base. It marks the coil BEFORE the breakout, while the stop is still small.
THE IDEA
Pradeep Bonde (Stockbee) trades short, violent moves: a stock breaks out and delivers most of its gain in three to five days. His Momentum Burst entry takes that breakout on the day it happens, typically a 4% up-day on expanding volume.
Anticipation is the same trade entered earlier. Instead of paying for the breakout day, you buy during the dull consolidation that precedes it, while the range is tight and volume has dried up. You give up confirmation; in exchange your stop sits just underneath a very tight base, so the position risks a fraction of what a breakout-day entry risks.
That trade-off only works if the base is genuinely tight. A wide, sloppy consolidation forces a distant stop, and then anticipating buys you nothing over simply waiting. The indicator is built around that constraint.
The pattern in one line: a real prior advance, then a short narrow base, volume drying up, price holding in the upper half of that base, and a stop you can place within a few percent.
HOW IT DECIDES
Nine conditions are evaluated on every bar. ALL must pass. There is no partial credit — one failure and the bar is not a setup, no matter how good the rest look.
1. Prior advance >= 15% over 40 bars
Anticipation continues a move. Without a prior thrust you are just buying a quiet stock.
2. Base width <= 10%
High to low of the last 10 bars. The best single proxy for whether the coil is real.
3. Average daily range <= 5%
Individual bars must be small, not just the envelope. Catches wide bars inside a narrow box.
4. Volume dry-up <= 0.85 x baseline
Base volume against the 50-day average. Supply exhausting is the tell.
5. Close location >= 50% of base
Price holding the upper half. A tight base sagging to its lows is a failed base.
6. Risk to stop <= 5%
The whole premise. If the stop cannot be placed tight, the setup is rejected outright.
7. Trend close > MA20 and MA50
Keeps you on the right side. Optional, can be switched off.
8. Not already fired day gain < 4%
A 4% day IS the Momentum Burst trigger. Past that you are no longer anticipating.
9. Liquidity >= $5 and 100k shares
Standard floor. Tight stops are unusable in illiquid names.
Why the risk gate is a rejection and not a penalty: every other quality can be traded off against the rest through the score. Stop distance cannot. A 12% stop on an anticipation entry is a different trade with a different expectancy, not a slightly worse version of the same one.
THE SCORE
Bars that clear all nine gates are graded 0-100. The score ranks candidates against each other; it never overrides a gate.
20 Base tightness — narrower than the cap scores higher
15 Close location within the base
15 Volume dry-up depth
15 Size of the prior advance
15 Risk distance — tighter stop, more points
10 Range contraction — last 3 bars vs the base
10 Trend alignment above both MAs
Grades:
85-100 A Everything lines up. Chart-review candidate.
75-84 A- Strong, usually one soft component.
65-74 B Playable smaller, or watch for improvement.
55-64 Watch Valid but unremarkable. Watchlist only.
under 55 — Not flagged. Nothing is drawn.
The 55 floor is an input, so you can raise it to see only the best coils.
READING THE CHART
Nothing is drawn unless a bar clears every gate and meets the score floor. A clean chart means no setup — that is the normal state.
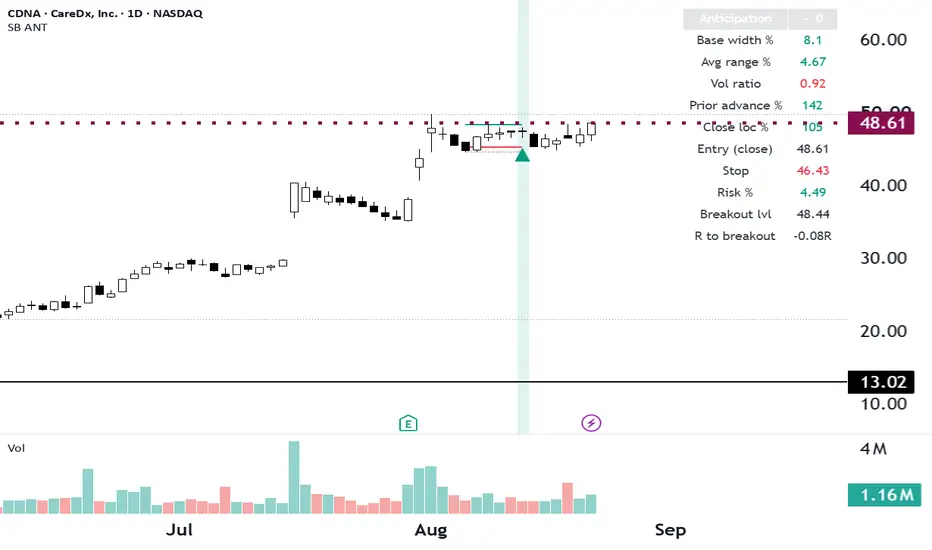
Triangle below bar First bar of a new setup. Marks the transition into the
state, so one coil produces one triangle, not a cluster.
Shaded zone Every bar where the setup remains valid. Its width shows
how long the coil has held.
Solid teal line Base high — where the Momentum Burst would trigger.
Anchored to the base that produced the signal and
spanning its full length.
Dotted line Base low. Reference only, this is NOT the stop.
Solid red line The actual stop, from the selected stop mode. Usually
well inside the base low.
Metrics table (values are for the most recent bar; each gate metric turns red when it fails, so a glance tells you what is blocking the setup):
Anticipation Rating and score. Grey header means no setup on this bar.
Base width % High to low of the base, as a percentage of the low.
Avg range % Mean daily high-low range across the base.
Vol ratio Base volume / 50-day baseline. Below 1.0 means drying up.
Prior advance % Rise from the pre-base low up to the base high.
Close loc % Where the close sits in the base. 100 = at the high.
Entry (close) The anticipation entry — you buy inside the base.
Stop Stop price per the selected mode.
Risk % Entry to stop. Red above the max-risk input.
Breakout lvl Base high plus one tick — the Momentum Burst trigger.
R to breakout Distance from entry to that trigger, in units of risk.
R to breakout is the number that justifies the trade. It answers: how much do I make, in R, just getting to the point where a breakout trader would enter? At 1.5R or more, anticipating is genuinely paying you for the earlier entry. Below 0.5R you are taking extra uncertainty for very little head start, and waiting for the breakout is the better trade.
INPUTS
BASE / CONSOLIDATION
Base lookback (bars) 10 Length of the consolidation window. 10 is about two
weeks. Bonde's bases run one to three weeks, so 5-15
is the useful band.
Max base width % 10.0 Rejects bases wider than this. The main tightness
control — lower finds fewer, better coils.
Max avg daily range % in base 5.0 Rejects bases built from wide individual bars. Raise
for high-ADR small caps, lower for large caps.
Min close location in base % 50.0 How high in the base price must close. 70+ demands
price pinned near the highs.
PRIOR ADVANCE
Prior-advance lookback (bars) 40 Window searched for the pre-base low. Longer accepts
older, slower advances.
Min prior advance % 15.0 Required thrust into the base. Raise to demand real
momentum; set to 0 to disable.
VOLUME
Volume baseline length 50 Averaging period the base volume is compared against.
Max base/baseline vol ratio 0.85 Dry-up threshold. 0.85 is mild; 0.6 demands a
pronounced volume collapse.
RISK / STOP
Stop reference Recent low Recent low = under the last N bars, the tight
Stockbee-style stop. Base low = under the whole base,
safest but widest. ATR multiple = volatility-scaled.
Fixed % = a flat percentage.
Recent-low lookback 3 Bars used by Recent low mode. 2-3 is tight, 5+
approaches the base low.
ATR length / ATR multiple 14/1.5 Used only in ATR mode.
Fixed stop % 4.0 Used only in Fixed % mode.
Max risk to stop % 5.0 HARD REJECTION. Setups needing a wider stop are
discarded. The most consequential input here.
FILTERS
Min price 5.0 Excludes low-priced names.
Min avg volume 100000 Liquidity floor on the volume baseline.
Require close above 20 & 50MA on Trend filter. Turn off to find bases forming under
the averages — a different, lower-probability trade.
Exclude if today gain % >= 4.0 Keeps anticipation separate from the breakout it
precedes.
OUTPUT
Min score to flag 55 Score floor. Raise to 70+ for high-grade coils only.
Show base high / low lines on Base boundary lines.
Show stop line on The red stop level.
Shade anticipation zone on Background tint over valid bars.
Extend levels right (bars) 0 Projects the lines forward N bars. Useful when
planning an entry.
TABLE
Show metrics table on Toggles the table.
Position Top right Any of the nine chart corners and edges.
Text size Normal Tiny through Huge. Raise it on large monitors.
TUNING
The defaults are a starting point, not settled numbers. Bonde does not publish exact thresholds, so these were chosen to match the described behaviour and should be adjusted to your universe.
Too few setups:
- Raise Max base width % to 12-14. This is the most common blocker.
- Raise Max risk to stop % to 6-7, accepting looser trades knowingly.
- Lower Min prior advance % to 10 for slower, larger names.
- Lower Min score to flag to 45 to see marginal coils.
Too many setups:
- Lower Max base width % to 7-8.
- Lower Max base/baseline vol ratio to 0.65 for real volume collapse.
- Raise Min close location % to 65-70.
- Raise Min score to flag to 70.
Volatility: high-ADR small caps need Max avg daily range % around 7-8 and a wider Max risk to stop %, or nothing will ever qualify. Large caps can run tighter than the defaults on both. Switching Stop reference to ATR multiple makes stop distance self-adjusting across a mixed watchlist.
These thresholds have not been backtested. Changing them changes which trades you take, and the only way to know whether a change helps is to test it against outcomes over a meaningful sample.
ALERTS
One alert condition is exposed, "Stockbee Anticipation", firing on the first bar of a new setup rather than on every bar it stays valid.
Right-click the chart, Add alert, choose Stockbee Anticipation Setup as the condition, and set it to Once Per Bar Close. On daily bars you are notified after the close, which is when the signal is final. Firing intrabar produces alerts that vanish by the close.
WHAT IT CANNOT DO
- It is not a signal service. It flags a chart state. Every candidate still
needs a look at the chart before it becomes a trade.
- It has no view on news or fundamentals. A tight base ahead of an earnings
date is a very different proposition and the script cannot see the date.
- It does not size positions or track exposure. It gives you entry, stop and
risk %; converting that into share count is your job.
- It does not know the market regime. Anticipation setups fail in bulk when
the broad market is under distribution. Check the market first.
- It has not been backtested. The thresholds are reasoned from the method as
described, not fitted to outcomes.
- One symbol at a time. Pine indicators evaluate the chart's symbol only.
Scanning a universe requires a screener.
Implements the Anticipation setup as taught by Pradeep Bonde (Stockbee). Not affiliated with or endorsed by him. Nothing here is financial advice — the indicator describes chart geometry, and decisions about risk remain entirely yours.
Finds stocks that have already run, then gone quiet — tight range, drying volume, holding near the highs of a small base. It marks the coil BEFORE the breakout, while the stop is still small.
THE IDEA
Pradeep Bonde (Stockbee) trades short, violent moves: a stock breaks out and delivers most of its gain in three to five days. His Momentum Burst entry takes that breakout on the day it happens, typically a 4% up-day on expanding volume.
Anticipation is the same trade entered earlier. Instead of paying for the breakout day, you buy during the dull consolidation that precedes it, while the range is tight and volume has dried up. You give up confirmation; in exchange your stop sits just underneath a very tight base, so the position risks a fraction of what a breakout-day entry risks.
That trade-off only works if the base is genuinely tight. A wide, sloppy consolidation forces a distant stop, and then anticipating buys you nothing over simply waiting. The indicator is built around that constraint.
The pattern in one line: a real prior advance, then a short narrow base, volume drying up, price holding in the upper half of that base, and a stop you can place within a few percent.
HOW IT DECIDES
Nine conditions are evaluated on every bar. ALL must pass. There is no partial credit — one failure and the bar is not a setup, no matter how good the rest look.
1. Prior advance >= 15% over 40 bars
Anticipation continues a move. Without a prior thrust you are just buying a quiet stock.
2. Base width <= 10%
High to low of the last 10 bars. The best single proxy for whether the coil is real.
3. Average daily range <= 5%
Individual bars must be small, not just the envelope. Catches wide bars inside a narrow box.
4. Volume dry-up <= 0.85 x baseline
Base volume against the 50-day average. Supply exhausting is the tell.
5. Close location >= 50% of base
Price holding the upper half. A tight base sagging to its lows is a failed base.
6. Risk to stop <= 5%
The whole premise. If the stop cannot be placed tight, the setup is rejected outright.
7. Trend close > MA20 and MA50
Keeps you on the right side. Optional, can be switched off.
8. Not already fired day gain < 4%
A 4% day IS the Momentum Burst trigger. Past that you are no longer anticipating.
9. Liquidity >= $5 and 100k shares
Standard floor. Tight stops are unusable in illiquid names.
Why the risk gate is a rejection and not a penalty: every other quality can be traded off against the rest through the score. Stop distance cannot. A 12% stop on an anticipation entry is a different trade with a different expectancy, not a slightly worse version of the same one.
THE SCORE
Bars that clear all nine gates are graded 0-100. The score ranks candidates against each other; it never overrides a gate.
20 Base tightness — narrower than the cap scores higher
15 Close location within the base
15 Volume dry-up depth
15 Size of the prior advance
15 Risk distance — tighter stop, more points
10 Range contraction — last 3 bars vs the base
10 Trend alignment above both MAs
Grades:
85-100 A Everything lines up. Chart-review candidate.
75-84 A- Strong, usually one soft component.
65-74 B Playable smaller, or watch for improvement.
55-64 Watch Valid but unremarkable. Watchlist only.
under 55 — Not flagged. Nothing is drawn.
The 55 floor is an input, so you can raise it to see only the best coils.
READING THE CHART
Nothing is drawn unless a bar clears every gate and meets the score floor. A clean chart means no setup — that is the normal state.
Triangle below bar First bar of a new setup. Marks the transition into the
state, so one coil produces one triangle, not a cluster.
Shaded zone Every bar where the setup remains valid. Its width shows
how long the coil has held.
Solid teal line Base high — where the Momentum Burst would trigger.
Anchored to the base that produced the signal and
spanning its full length.
Dotted line Base low. Reference only, this is NOT the stop.
Solid red line The actual stop, from the selected stop mode. Usually
well inside the base low.
Metrics table (values are for the most recent bar; each gate metric turns red when it fails, so a glance tells you what is blocking the setup):
Anticipation Rating and score. Grey header means no setup on this bar.
Base width % High to low of the base, as a percentage of the low.
Avg range % Mean daily high-low range across the base.
Vol ratio Base volume / 50-day baseline. Below 1.0 means drying up.
Prior advance % Rise from the pre-base low up to the base high.
Close loc % Where the close sits in the base. 100 = at the high.
Entry (close) The anticipation entry — you buy inside the base.
Stop Stop price per the selected mode.
Risk % Entry to stop. Red above the max-risk input.
Breakout lvl Base high plus one tick — the Momentum Burst trigger.
R to breakout Distance from entry to that trigger, in units of risk.
R to breakout is the number that justifies the trade. It answers: how much do I make, in R, just getting to the point where a breakout trader would enter? At 1.5R or more, anticipating is genuinely paying you for the earlier entry. Below 0.5R you are taking extra uncertainty for very little head start, and waiting for the breakout is the better trade.
INPUTS
BASE / CONSOLIDATION
Base lookback (bars) 10 Length of the consolidation window. 10 is about two
weeks. Bonde's bases run one to three weeks, so 5-15
is the useful band.
Max base width % 10.0 Rejects bases wider than this. The main tightness
control — lower finds fewer, better coils.
Max avg daily range % in base 5.0 Rejects bases built from wide individual bars. Raise
for high-ADR small caps, lower for large caps.
Min close location in base % 50.0 How high in the base price must close. 70+ demands
price pinned near the highs.
PRIOR ADVANCE
Prior-advance lookback (bars) 40 Window searched for the pre-base low. Longer accepts
older, slower advances.
Min prior advance % 15.0 Required thrust into the base. Raise to demand real
momentum; set to 0 to disable.
VOLUME
Volume baseline length 50 Averaging period the base volume is compared against.
Max base/baseline vol ratio 0.85 Dry-up threshold. 0.85 is mild; 0.6 demands a
pronounced volume collapse.
RISK / STOP
Stop reference Recent low Recent low = under the last N bars, the tight
Stockbee-style stop. Base low = under the whole base,
safest but widest. ATR multiple = volatility-scaled.
Fixed % = a flat percentage.
Recent-low lookback 3 Bars used by Recent low mode. 2-3 is tight, 5+
approaches the base low.
ATR length / ATR multiple 14/1.5 Used only in ATR mode.
Fixed stop % 4.0 Used only in Fixed % mode.
Max risk to stop % 5.0 HARD REJECTION. Setups needing a wider stop are
discarded. The most consequential input here.
FILTERS
Min price 5.0 Excludes low-priced names.
Min avg volume 100000 Liquidity floor on the volume baseline.
Require close above 20 & 50MA on Trend filter. Turn off to find bases forming under
the averages — a different, lower-probability trade.
Exclude if today gain % >= 4.0 Keeps anticipation separate from the breakout it
precedes.
OUTPUT
Min score to flag 55 Score floor. Raise to 70+ for high-grade coils only.
Show base high / low lines on Base boundary lines.
Show stop line on The red stop level.
Shade anticipation zone on Background tint over valid bars.
Extend levels right (bars) 0 Projects the lines forward N bars. Useful when
planning an entry.
TABLE
Show metrics table on Toggles the table.
Position Top right Any of the nine chart corners and edges.
Text size Normal Tiny through Huge. Raise it on large monitors.
TUNING
The defaults are a starting point, not settled numbers. Bonde does not publish exact thresholds, so these were chosen to match the described behaviour and should be adjusted to your universe.
Too few setups:
- Raise Max base width % to 12-14. This is the most common blocker.
- Raise Max risk to stop % to 6-7, accepting looser trades knowingly.
- Lower Min prior advance % to 10 for slower, larger names.
- Lower Min score to flag to 45 to see marginal coils.
Too many setups:
- Lower Max base width % to 7-8.
- Lower Max base/baseline vol ratio to 0.65 for real volume collapse.
- Raise Min close location % to 65-70.
- Raise Min score to flag to 70.
Volatility: high-ADR small caps need Max avg daily range % around 7-8 and a wider Max risk to stop %, or nothing will ever qualify. Large caps can run tighter than the defaults on both. Switching Stop reference to ATR multiple makes stop distance self-adjusting across a mixed watchlist.
These thresholds have not been backtested. Changing them changes which trades you take, and the only way to know whether a change helps is to test it against outcomes over a meaningful sample.
ALERTS
One alert condition is exposed, "Stockbee Anticipation", firing on the first bar of a new setup rather than on every bar it stays valid.
Right-click the chart, Add alert, choose Stockbee Anticipation Setup as the condition, and set it to Once Per Bar Close. On daily bars you are notified after the close, which is when the signal is final. Firing intrabar produces alerts that vanish by the close.
WHAT IT CANNOT DO
- It is not a signal service. It flags a chart state. Every candidate still
needs a look at the chart before it becomes a trade.
- It has no view on news or fundamentals. A tight base ahead of an earnings
date is a very different proposition and the script cannot see the date.
- It does not size positions or track exposure. It gives you entry, stop and
risk %; converting that into share count is your job.
- It does not know the market regime. Anticipation setups fail in bulk when
the broad market is under distribution. Check the market first.
- It has not been backtested. The thresholds are reasoned from the method as
described, not fitted to outcomes.
- One symbol at a time. Pine indicators evaluate the chart's symbol only.
Scanning a universe requires a screener.
Implements the Anticipation setup as taught by Pradeep Bonde (Stockbee). Not affiliated with or endorsed by him. Nothing here is financial advice — the indicator describes chart geometry, and decisions about risk remain entirely yours.

Feragatname
Bilgiler ve yayınlar, TradingView tarafından sağlanan veya onaylanan finansal, yatırım, alım satım veya diğer türden tavsiye veya öneriler anlamına gelmez ve teşkil etmez. Kullanım Koşulları bölümünde daha fazlasını okuyun.
Feragatname
Bilgiler ve yayınlar, TradingView tarafından sağlanan veya onaylanan finansal, yatırım, alım satım veya diğer türden tavsiye veya öneriler anlamına gelmez ve teşkil etmez. Kullanım Koşulları bölümünde daha fazlasını okuyun.