OPEN-SOURCE SCRIPT
Strong Risk Heatmap Terminal | ProjectSyndicate
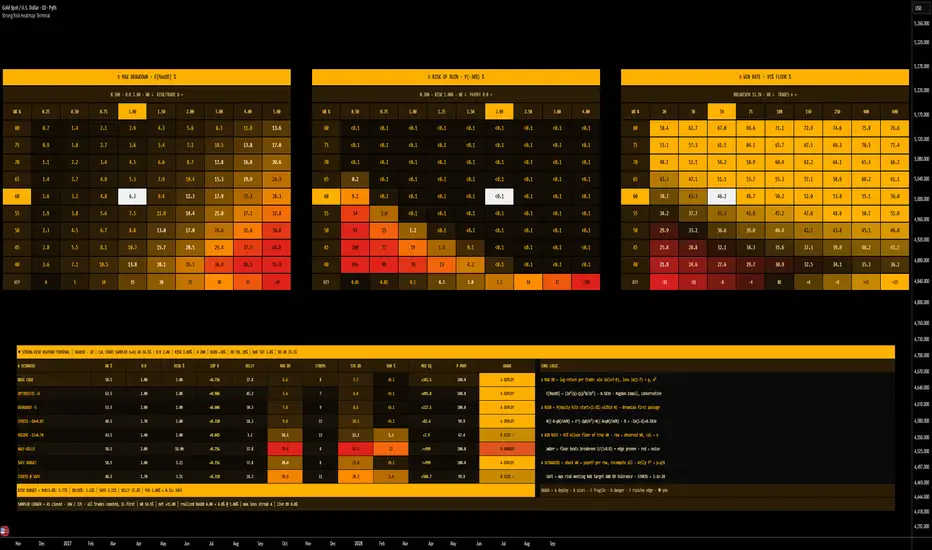
◾Strong Risk Heatmap Terminal takes the four numbers that decide whether a trading account survives — win rate, payoff (R:R), risk per trade and number of trades — and turns them into three large, side-by-side risk heatmaps plus a full scenario desk, all on one screen in a compact Bloomberg amber terminal.
◾Max Drawdown, Risk of Ruin and Win-Rate confidence are each mapped as a 9×9 grid around your own numbers, your exact position is lit up as a white cell, and every map is backed by closed-form probability math validated against a 40,000-path Monte Carlo. The whole tool runs on one idea: a win rate means nothing on its own — but when you can see the drawdown it produces at every size, the probability it ruins you within N trades, and whether your sample is even large enough to prove it, position sizing stops being a guess and becomes a number.
◾This is a risk-of-ruin and position-sizing terminal, not a signal generator. It tells you how deep your drawdowns will realistically go, how close you are to the ruin cliff, what the largest safe risk per trade is, and whether your measured edge is real or just noise — on any symbol, any timeframe, for any strategy you feed it.
🟢🔴 Summary how to use this, more details below, read entire guide. Two clean reads: size it, then prove it. Use the Risk Budget line to find the largest risk per trade that keeps both ruin probability and expected drawdown inside your limits — if your current risk is above SAFE, cut size. Then check the Win-Rate map — if your cell is red, your sample is too small to call it an edge yet, no matter how good the win rate looks. The Scenario Desk shows what happens to all of it when your edge degrades. Runs on any chart and any timeframe.
⚠️ YOUR STRATEGY vs THE BUILT-IN SAMPLER — By default the heatmaps are calibrated by a built-in Chart Sampler: a simple Donchian breakout with an ATR stop and a fixed R:R target, run on the current chart. It exists to give the terminal a real, honestly-measured win rate out of the box — it is NOT your strategy. To analyse your own system, switch Calibration Source to Manual and type in your own win rate, sample size and average R:R from your journal or backtest. Until the sampler has closed the minimum number of trades (30 by default) the terminal automatically uses your manual inputs.
🧱 The Math Engine — closed-form, Monte-Carlo-checked — Every cell is computed, not estimated by eye. Each trade is modelled as a log-return under fixed-fractional sizing (win: ln(1+f·R), loss: ln(1−f)), which gives a per-trade drift μ and variance σ². From there:
▪️ Expected Max Drawdown — the Magdon-Ismail expected-maximum-drawdown law for a random walk with drift, using simulated Q-functions, with a discrete-trade correction (−0.583σ, Broadie-Glasserman-Kou).
▪️ Risk of Ruin — the exact Brownian first-passage probability of touching your ruin floor within N trades: Φ((−B−μN)/σ√N) + e^(−2μB/σ²)·Φ((−B+μN)/σ√N), with the barrier shifted for discrete trades. Finite horizon, so it works for negative-edge systems too.
▪️ Win-Rate floor — the Wilson score lower bound of your true win rate at 90%, 95% or 99% confidence.
▪️ Losing streaks — the Schilling longest-run law with a Poisson tail for the 1-in-20 (P95) streak.
▪️ Kelly — f* = p − q/R.
Validated offline against a 40,000-path discrete-trade Monte Carlo: risk of ruin within ~1.4 percentage points, P95 losing streak exact, and expected max drawdown deliberately conservative — it never understates drawdown, and overstates it by 0–7 points at the most extreme size and payoff combinations.
📐 Three Heatmaps · One Screen — Each map is a 9×9 grid. Rows are win rates centred on your base win rate (5-point steps by default, highest at the top). Your cell burns white so you find yourself instantly, the matching row and column headers light up amber, and every cell has a hover tooltip with the full breakdown.
◆ ① MAX DRAWDOWN — rows: win rate · columns: risk per trade 0.25% → 5.00% · R:R fixed. Each cell is the expected peak-to-trough drawdown over your N-trade horizon. Amber sits exactly at your Max-DD tolerance; the scale runs red at twice it. Bottom-right is the drawdown cliff: low win rate plus big size.
◆ ② RISK OF RUIN — rows: win rate · columns: payoff R:R 0.50 → 4.00 · risk fixed. Each cell is the probability your equity falls X% below its starting value within N trades. Log-scaled heat, with the amber ridge at your acceptable RoR target. Left of the ridge is survivable payoff; right of it is mathematically doomed.
◆ ③ WIN RATE — rows: observed win rate · columns: trades in sample 20 → 600. Each cell is the worst plausible TRUE win rate given what you measured (Wilson lower bound), coloured against breakeven 1/(1+R:R). Amber = even the worst plausible case beats breakeven, so the edge is statistically proven. Red = the sample is too small, and the edge is not yet distinguishable from noise.
Every map carries a KEY bar along the bottom so you can read the colour scale directly in percent.
XAUUSD 1D snapshot
🏷️ The Scenario Desk — One panel under the heatmaps stress-tests your system across eight rows:
▪️ BASE CASE — your numbers as they are.
▪️ OPTIMISTIC +5 — win rate up 5 points.
▪️ DEGRADED −5 — win rate down 5 points.
▪️ STRESS −10 ×0.85 — win rate down 10 points and payoff cut to 85%.
▪️ REGIME −15 ×0.70 — win rate down 15 points and payoff cut to 70%: the edge-decay scenario.
▪️ HALF-KELLY — what half-Kelly sizing would actually do to drawdown and ruin.
▪️ SAFE BUDGET — your system at the largest size that meets both your limits.
▪️ STRESS @ SAFE — does that safe size still survive a stress regime?
Every row recomputes the full stack: win rate, R:R, risk %, expectancy in R, Kelly %, expected Max DD, the 1-in-20 losing streak and the drawdown it alone causes, risk of ruin, median ending equity, probability of being in profit after N trades, and a grade. All shocks are adjustable in settings.
🔥 The Grade Engine — Every scenario is auto-graded:
▪️ A DEPLOY — ruin below your target and expected drawdown inside your tolerance.
▪️ B SIZE ↓ — close, but size should come down.
▪️ C FRAGILE — ruin under 15%: survivable, not robust.
▪️ D DANGER — ruin under 40%.
▪️ F RUIN / F NO EDGE — ruin is likely, or the expectancy is zero or negative.
A burns amber, F burns red. You read the health of every scenario with your peripheral vision before you read a single number.
💰 The Risk Budget Line — The single most important line on the screen. It solves for the largest risk per trade that keeps risk of ruin under your target, the largest that keeps expected drawdown inside your tolerance, takes the stricter of the two as SAFE, shows your Kelly fraction, and tells you how your current risk compares: "YOU 1.00% = 0.31× SAFE". The line turns red the moment you are sizing above SAFE.
XAUUSD / NQ / BTC snapshot
📒 The Sampler Ledger — honest stats — When the Chart Sampler is active, the bottom line reports its full record: trades closed, wins and losses, win rate, net R, realized max drawdown in R and in % at your risk setting, longest losing streak, and live drawdown. Every closed trade is counted and drawn — wins and losses — with no filtering of fast stop-outs. If a bar touches both the stop and the target, it is booked as a loss. Trades are only evaluated on confirmed bars.
📈 On the Price Chart — Sampler entries (amber triangles), W / L exit markers on every closed trade, the active stop and target as live lines, and an optional drawdown-regime shading that warms the background as the sampler's live drawdown approaches your tolerance.
📋 Bloomberg Amber Terminal — Black terminal background, amber headline strips, bold monospaced figures, gradient heat from calm brown through amber and orange to red, white cursor cell for your position, and tile gutters that match your chart background automatically. All three heatmaps sit across the top of the chart and the scenario desk across the bottom, with price still visible in between. Every table is rebuilt on every update so nothing drifts or clips on a live market.
🔔 Native Alerts —
▪️ Sampler Stop Hit — a sampler trade stopped out (−1R).
▪️ Sampler Target Hit — a sampler trade reached its target.
▪️ Drawdown Tolerance Breached — the sampler's live drawdown crossed your Max-DD tolerance.
🔧 Fully Customizable — Calibration source (Chart Sampler / Manual), manual win rate and sample size, payoff R:R, risk per trade, horizon N, ruin threshold, Max-DD tolerance, acceptable RoR, confidence level (90 / 95 / 99%); sampler breakout length, ATR length and stop multiple, EMA trend filter, minimum trades to calibrate; win-rate row step; every scenario shock; and full display sizing — heatmap cell width and height, heatmap and panel text size, top offset (keeps the symbol legend clear), bottom offset, panel width and row height, and gutter colour.
🎯 Why this is different — Most risk-of-ruin tools give you one number from one formula with no context, or a spreadsheet you have to fill in by hand. This one maps drawdown, ruin and statistical confidence across 81 combinations each, puts you on all three maps at once, stress-tests eight scenarios, solves your safe size automatically, and checks its own math against Monte Carlo. The chart does the filtering — you see instantly whether you are oversized, under-proven, or ready to deploy.
🚀 Apply on any chart and any timeframe. In Manual mode the terminal is independent of the chart, so load it anywhere and enter your own strategy's numbers. In Chart Sampler mode it measures the symbol and timeframe you are on.
🎯 How To Use It — Two Approaches
Everything hinges on the Risk Budget line and your white cell. A great win rate on a red Win-Rate cell, or a risk setting above SAFE, is where the real information sits.
◾ 1 SIZE IT — find the largest safe risk
This is the core read. Your edge is what it is; the only thing you fully control is size.
▪️ Setup: enter your win rate, average R:R and planned horizon (Manual mode), then set your ruin threshold, Max-DD tolerance and acceptable RoR to match your account or prop-firm rules.
▪️ Read: the Risk Budget line gives SAFE. On the Max Drawdown map, your white cell should sit left of the amber column; on the Risk of Ruin map it should sit left of the amber ridge.
▪️ Action: if YOU is above 1.00× SAFE, cut risk per trade until the line turns amber. Check that STRESS @ SAFE still grades A or B — if it doesn't, size lower still.
▪️ Never: size at full Kelly. The HALF-KELLY row shows you why.
⚖️ The cleanest version: BASE CASE grades A DEPLOY, STRESS @ SAFE grades A or B, your Max DD cell is calm brown, and your Risk of Ruin cell reads <0.1. That is a sized, survivable system.
◾ 2 PROVE IT — check the edge is real before you scale
The mirror case, and the one that matters before you increase size.
▪️ Setup: enter your observed win rate and the number of trades it was measured on.
▪️ Read: find your cell on the Win-Rate map. Amber means the worst plausible true win rate still beats breakeven — the edge is statistically proven at your chosen confidence. Red means it isn't yet.
▪️ Action: if your cell is red, keep size small and keep collecting trades. Move along the row to the right to see how many trades you need before the cell turns amber.
▪️ Then: watch the DEGRADED and REGIME rows. If one modest drop in win rate turns the grade to D or F, your edge is thin and your size must reflect that.
⚖️ Watch the Win-Rate map before the other two. A 65% win rate over 20 trades is a coin you have not finished flipping; the same 65% over 250 trades is an edge.
Rule of thumb: ⭐ Risk Budget amber and BASE graded A → you are sized correctly. ⭐ Risk Budget red → cut size to SAFE before anything else. ⭐ Win-Rate cell red → the edge is unproven, trade smaller and collect more data. ⭐ Expectancy ≤ 0 (F NO EDGE) → no size is safe, fix the strategy first.
⚠️ IMPORTANT NOTICE: Strong Risk Heatmap Terminal [Bloomberg] is a risk-modelling and position-sizing tool. Its heatmaps, scenario grades and risk budget are probability estimates from an idealised model: fixed-fractional sizing, independent trades, and a fixed payoff of +R per win and −1R per loss. Real trading adds variable trade outcomes, correlated losing streaks, slippage, fees, gaps and regime changes, so real drawdowns can exceed the model. The built-in Chart Sampler is a calibration model, not a recommended strategy; its statistics describe that model on the current chart only. The Max Drawdown figures are conservative by design, but no figure here is a guarantee. This is decision support, not a trade trigger or financial advice. Always combine it with your own strategy, testing and risk management. Past results do not guarantee future results.
◾Max Drawdown, Risk of Ruin and Win-Rate confidence are each mapped as a 9×9 grid around your own numbers, your exact position is lit up as a white cell, and every map is backed by closed-form probability math validated against a 40,000-path Monte Carlo. The whole tool runs on one idea: a win rate means nothing on its own — but when you can see the drawdown it produces at every size, the probability it ruins you within N trades, and whether your sample is even large enough to prove it, position sizing stops being a guess and becomes a number.
◾This is a risk-of-ruin and position-sizing terminal, not a signal generator. It tells you how deep your drawdowns will realistically go, how close you are to the ruin cliff, what the largest safe risk per trade is, and whether your measured edge is real or just noise — on any symbol, any timeframe, for any strategy you feed it.
🟢🔴 Summary how to use this, more details below, read entire guide. Two clean reads: size it, then prove it. Use the Risk Budget line to find the largest risk per trade that keeps both ruin probability and expected drawdown inside your limits — if your current risk is above SAFE, cut size. Then check the Win-Rate map — if your cell is red, your sample is too small to call it an edge yet, no matter how good the win rate looks. The Scenario Desk shows what happens to all of it when your edge degrades. Runs on any chart and any timeframe.
⚠️ YOUR STRATEGY vs THE BUILT-IN SAMPLER — By default the heatmaps are calibrated by a built-in Chart Sampler: a simple Donchian breakout with an ATR stop and a fixed R:R target, run on the current chart. It exists to give the terminal a real, honestly-measured win rate out of the box — it is NOT your strategy. To analyse your own system, switch Calibration Source to Manual and type in your own win rate, sample size and average R:R from your journal or backtest. Until the sampler has closed the minimum number of trades (30 by default) the terminal automatically uses your manual inputs.
🧱 The Math Engine — closed-form, Monte-Carlo-checked — Every cell is computed, not estimated by eye. Each trade is modelled as a log-return under fixed-fractional sizing (win: ln(1+f·R), loss: ln(1−f)), which gives a per-trade drift μ and variance σ². From there:
▪️ Expected Max Drawdown — the Magdon-Ismail expected-maximum-drawdown law for a random walk with drift, using simulated Q-functions, with a discrete-trade correction (−0.583σ, Broadie-Glasserman-Kou).
▪️ Risk of Ruin — the exact Brownian first-passage probability of touching your ruin floor within N trades: Φ((−B−μN)/σ√N) + e^(−2μB/σ²)·Φ((−B+μN)/σ√N), with the barrier shifted for discrete trades. Finite horizon, so it works for negative-edge systems too.
▪️ Win-Rate floor — the Wilson score lower bound of your true win rate at 90%, 95% or 99% confidence.
▪️ Losing streaks — the Schilling longest-run law with a Poisson tail for the 1-in-20 (P95) streak.
▪️ Kelly — f* = p − q/R.
Validated offline against a 40,000-path discrete-trade Monte Carlo: risk of ruin within ~1.4 percentage points, P95 losing streak exact, and expected max drawdown deliberately conservative — it never understates drawdown, and overstates it by 0–7 points at the most extreme size and payoff combinations.
📐 Three Heatmaps · One Screen — Each map is a 9×9 grid. Rows are win rates centred on your base win rate (5-point steps by default, highest at the top). Your cell burns white so you find yourself instantly, the matching row and column headers light up amber, and every cell has a hover tooltip with the full breakdown.
◆ ① MAX DRAWDOWN — rows: win rate · columns: risk per trade 0.25% → 5.00% · R:R fixed. Each cell is the expected peak-to-trough drawdown over your N-trade horizon. Amber sits exactly at your Max-DD tolerance; the scale runs red at twice it. Bottom-right is the drawdown cliff: low win rate plus big size.
◆ ② RISK OF RUIN — rows: win rate · columns: payoff R:R 0.50 → 4.00 · risk fixed. Each cell is the probability your equity falls X% below its starting value within N trades. Log-scaled heat, with the amber ridge at your acceptable RoR target. Left of the ridge is survivable payoff; right of it is mathematically doomed.
◆ ③ WIN RATE — rows: observed win rate · columns: trades in sample 20 → 600. Each cell is the worst plausible TRUE win rate given what you measured (Wilson lower bound), coloured against breakeven 1/(1+R:R). Amber = even the worst plausible case beats breakeven, so the edge is statistically proven. Red = the sample is too small, and the edge is not yet distinguishable from noise.
Every map carries a KEY bar along the bottom so you can read the colour scale directly in percent.
XAUUSD 1D snapshot
🏷️ The Scenario Desk — One panel under the heatmaps stress-tests your system across eight rows:
▪️ BASE CASE — your numbers as they are.
▪️ OPTIMISTIC +5 — win rate up 5 points.
▪️ DEGRADED −5 — win rate down 5 points.
▪️ STRESS −10 ×0.85 — win rate down 10 points and payoff cut to 85%.
▪️ REGIME −15 ×0.70 — win rate down 15 points and payoff cut to 70%: the edge-decay scenario.
▪️ HALF-KELLY — what half-Kelly sizing would actually do to drawdown and ruin.
▪️ SAFE BUDGET — your system at the largest size that meets both your limits.
▪️ STRESS @ SAFE — does that safe size still survive a stress regime?
Every row recomputes the full stack: win rate, R:R, risk %, expectancy in R, Kelly %, expected Max DD, the 1-in-20 losing streak and the drawdown it alone causes, risk of ruin, median ending equity, probability of being in profit after N trades, and a grade. All shocks are adjustable in settings.
🔥 The Grade Engine — Every scenario is auto-graded:
▪️ A DEPLOY — ruin below your target and expected drawdown inside your tolerance.
▪️ B SIZE ↓ — close, but size should come down.
▪️ C FRAGILE — ruin under 15%: survivable, not robust.
▪️ D DANGER — ruin under 40%.
▪️ F RUIN / F NO EDGE — ruin is likely, or the expectancy is zero or negative.
A burns amber, F burns red. You read the health of every scenario with your peripheral vision before you read a single number.
💰 The Risk Budget Line — The single most important line on the screen. It solves for the largest risk per trade that keeps risk of ruin under your target, the largest that keeps expected drawdown inside your tolerance, takes the stricter of the two as SAFE, shows your Kelly fraction, and tells you how your current risk compares: "YOU 1.00% = 0.31× SAFE". The line turns red the moment you are sizing above SAFE.
XAUUSD / NQ / BTC snapshot
📒 The Sampler Ledger — honest stats — When the Chart Sampler is active, the bottom line reports its full record: trades closed, wins and losses, win rate, net R, realized max drawdown in R and in % at your risk setting, longest losing streak, and live drawdown. Every closed trade is counted and drawn — wins and losses — with no filtering of fast stop-outs. If a bar touches both the stop and the target, it is booked as a loss. Trades are only evaluated on confirmed bars.
📈 On the Price Chart — Sampler entries (amber triangles), W / L exit markers on every closed trade, the active stop and target as live lines, and an optional drawdown-regime shading that warms the background as the sampler's live drawdown approaches your tolerance.
📋 Bloomberg Amber Terminal — Black terminal background, amber headline strips, bold monospaced figures, gradient heat from calm brown through amber and orange to red, white cursor cell for your position, and tile gutters that match your chart background automatically. All three heatmaps sit across the top of the chart and the scenario desk across the bottom, with price still visible in between. Every table is rebuilt on every update so nothing drifts or clips on a live market.
🔔 Native Alerts —
▪️ Sampler Stop Hit — a sampler trade stopped out (−1R).
▪️ Sampler Target Hit — a sampler trade reached its target.
▪️ Drawdown Tolerance Breached — the sampler's live drawdown crossed your Max-DD tolerance.
🔧 Fully Customizable — Calibration source (Chart Sampler / Manual), manual win rate and sample size, payoff R:R, risk per trade, horizon N, ruin threshold, Max-DD tolerance, acceptable RoR, confidence level (90 / 95 / 99%); sampler breakout length, ATR length and stop multiple, EMA trend filter, minimum trades to calibrate; win-rate row step; every scenario shock; and full display sizing — heatmap cell width and height, heatmap and panel text size, top offset (keeps the symbol legend clear), bottom offset, panel width and row height, and gutter colour.
🎯 Why this is different — Most risk-of-ruin tools give you one number from one formula with no context, or a spreadsheet you have to fill in by hand. This one maps drawdown, ruin and statistical confidence across 81 combinations each, puts you on all three maps at once, stress-tests eight scenarios, solves your safe size automatically, and checks its own math against Monte Carlo. The chart does the filtering — you see instantly whether you are oversized, under-proven, or ready to deploy.
🚀 Apply on any chart and any timeframe. In Manual mode the terminal is independent of the chart, so load it anywhere and enter your own strategy's numbers. In Chart Sampler mode it measures the symbol and timeframe you are on.
🎯 How To Use It — Two Approaches
Everything hinges on the Risk Budget line and your white cell. A great win rate on a red Win-Rate cell, or a risk setting above SAFE, is where the real information sits.
◾ 1 SIZE IT — find the largest safe risk
This is the core read. Your edge is what it is; the only thing you fully control is size.
▪️ Setup: enter your win rate, average R:R and planned horizon (Manual mode), then set your ruin threshold, Max-DD tolerance and acceptable RoR to match your account or prop-firm rules.
▪️ Read: the Risk Budget line gives SAFE. On the Max Drawdown map, your white cell should sit left of the amber column; on the Risk of Ruin map it should sit left of the amber ridge.
▪️ Action: if YOU is above 1.00× SAFE, cut risk per trade until the line turns amber. Check that STRESS @ SAFE still grades A or B — if it doesn't, size lower still.
▪️ Never: size at full Kelly. The HALF-KELLY row shows you why.
⚖️ The cleanest version: BASE CASE grades A DEPLOY, STRESS @ SAFE grades A or B, your Max DD cell is calm brown, and your Risk of Ruin cell reads <0.1. That is a sized, survivable system.
◾ 2 PROVE IT — check the edge is real before you scale
The mirror case, and the one that matters before you increase size.
▪️ Setup: enter your observed win rate and the number of trades it was measured on.
▪️ Read: find your cell on the Win-Rate map. Amber means the worst plausible true win rate still beats breakeven — the edge is statistically proven at your chosen confidence. Red means it isn't yet.
▪️ Action: if your cell is red, keep size small and keep collecting trades. Move along the row to the right to see how many trades you need before the cell turns amber.
▪️ Then: watch the DEGRADED and REGIME rows. If one modest drop in win rate turns the grade to D or F, your edge is thin and your size must reflect that.
⚖️ Watch the Win-Rate map before the other two. A 65% win rate over 20 trades is a coin you have not finished flipping; the same 65% over 250 trades is an edge.
Rule of thumb: ⭐ Risk Budget amber and BASE graded A → you are sized correctly. ⭐ Risk Budget red → cut size to SAFE before anything else. ⭐ Win-Rate cell red → the edge is unproven, trade smaller and collect more data. ⭐ Expectancy ≤ 0 (F NO EDGE) → no size is safe, fix the strategy first.
⚠️ IMPORTANT NOTICE: Strong Risk Heatmap Terminal [Bloomberg] is a risk-modelling and position-sizing tool. Its heatmaps, scenario grades and risk budget are probability estimates from an idealised model: fixed-fractional sizing, independent trades, and a fixed payoff of +R per win and −1R per loss. Real trading adds variable trade outcomes, correlated losing streaks, slippage, fees, gaps and regime changes, so real drawdowns can exceed the model. The built-in Chart Sampler is a calibration model, not a recommended strategy; its statistics describe that model on the current chart only. The Max Drawdown figures are conservative by design, but no figure here is a guarantee. This is decision support, not a trade trigger or financial advice. Always combine it with your own strategy, testing and risk management. Past results do not guarantee future results.
Açık kaynak kodlu komut dosyası
Gerçek TradingView ruhuyla, bu komut dosyasının mimarı, yatırımcıların işlevselliğini inceleyip doğrulayabilmesi için onu açık kaynaklı hale getirdi. Yazarı tebrik ederiz! Ücretsiz olarak kullanabilseniz de, kodu yeniden yayınlamanın Topluluk Kurallarımıza tabi olduğunu unutmayın.

Gold Algo Trading · +1100% YTD · max DD <5%
Syndicate Ultimate · 5 algo systems · 1 bundle
1 payment · lifetime access · no monthly fees
+ FX · NQ/ES · 10+ yr institutional desk
syndicate001.com
Join on Telegram
t.me/aisyndicate001
Syndicate Ultimate · 5 algo systems · 1 bundle
1 payment · lifetime access · no monthly fees
+ FX · NQ/ES · 10+ yr institutional desk
syndicate001.com
Join on Telegram
t.me/aisyndicate001
Feragatname
Bilgiler ve yayınlar, TradingView tarafından sağlanan veya onaylanan finansal, yatırım, alım satım veya diğer türden tavsiye veya öneriler anlamına gelmez ve teşkil etmez. Kullanım Koşulları bölümünde daha fazlasını okuyun.
Açık kaynak kodlu komut dosyası
Gerçek TradingView ruhuyla, bu komut dosyasının mimarı, yatırımcıların işlevselliğini inceleyip doğrulayabilmesi için onu açık kaynaklı hale getirdi. Yazarı tebrik ederiz! Ücretsiz olarak kullanabilseniz de, kodu yeniden yayınlamanın Topluluk Kurallarımıza tabi olduğunu unutmayın.
Gold Algo Trading · +1100% YTD · max DD <5%
Syndicate Ultimate · 5 algo systems · 1 bundle
1 payment · lifetime access · no monthly fees
+ FX · NQ/ES · 10+ yr institutional desk
syndicate001.com
Join on Telegram
t.me/aisyndicate001
Syndicate Ultimate · 5 algo systems · 1 bundle
1 payment · lifetime access · no monthly fees
+ FX · NQ/ES · 10+ yr institutional desk
syndicate001.com
Join on Telegram
t.me/aisyndicate001
Feragatname
Bilgiler ve yayınlar, TradingView tarafından sağlanan veya onaylanan finansal, yatırım, alım satım veya diğer türden tavsiye veya öneriler anlamına gelmez ve teşkil etmez. Kullanım Koşulları bölümünde daha fazlasını okuyun.