HLC Oscillator [NJ]
✧ OVERVIEW ✧
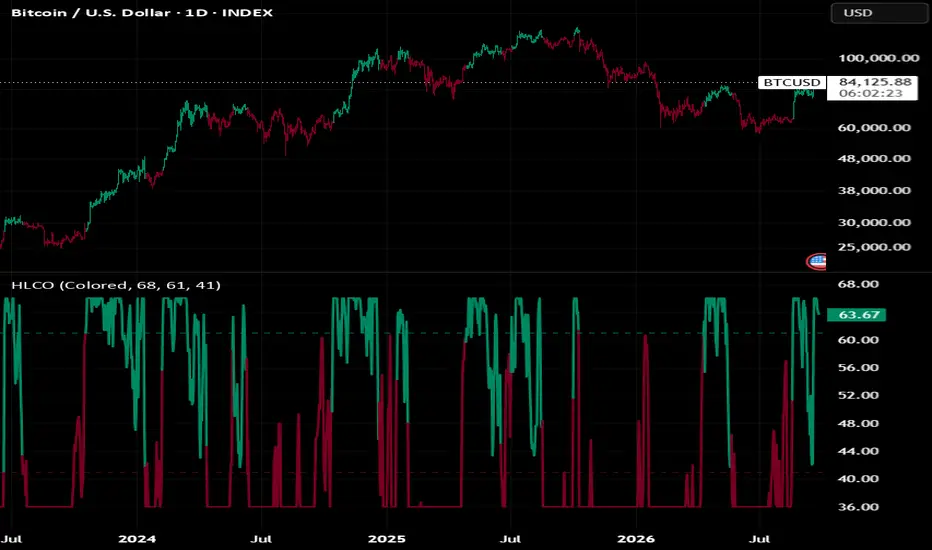
HLC Oscillator measures relative price strength by comparing current high, low, and close with their historical values over a selected lookback period.
The three comparison counts are averaged into a single score, which is then used to identify bullish and bearish conditions with separate thresholds.

✧ SETTINGS ✧
Color Mode
Switches between colored and neutral visualization.
Color Candles
Shows or hides candle coloring based on the current signal.
Count Length
Controls how much price history is used for the high, low, and close comparisons.
Long Threshold
Controls the score required for the indicator to switch to a bullish condition.
Short Threshold
Controls the score required for the indicator to switch to a bearish condition.
✧ HOW IT WORKS ✧
HLC Comparison
Indicator compares current high, low, and close with their corresponding historical values over the selected lookback period.
Each time a current value is above its historical value, comparison count increases.
Combined Score
High, low, and close comparison counts are combined and averaged into a single oscillator value.
Higher values indicate that the current HLC values are positioned above a larger portion of their recent history, while lower values indicate weaker relative price positioning.
Signal Logic
A bullish condition is activated when the oscillator rises above the Long Threshold.
A bearish condition is activated when the oscillator falls below the Short Threshold.
While the oscillator remains between two thresholds, previous condition stays active.
✧ VISUALIZATION ✧
Oscillator changes color based on the active condition:
Green represents a bullish condition.
Red represents a bearish condition.
Neutral mode displays the same conditions using light and dark shades.
The same colors can optionally be applied directly to the chart candles.
Plotted oscillator is capped slightly beyond the threshold levels to keep the relevant signal area in focus. This does not affect the underlying calculation or signal logic.
✧ USAGE ✧
HLC Oscillator can be used to identify:
Bullish and bearish price strength
Changes in relative price positioning
Potential directional shifts
Trend confirmation
Momentum context
Additional confirmation for other technical analysis
Indicator is designed to provide directional market context based on the relative position of current price values within their recent history.
As with any technical indicator, it is best used alongside other forms of analysis rather than as a standalone entry or exit signal.
HLC Oscillator measures relative price strength by comparing current high, low, and close with their historical values over a selected lookback period.
The three comparison counts are averaged into a single score, which is then used to identify bullish and bearish conditions with separate thresholds.
✧ SETTINGS ✧
Color Mode
Switches between colored and neutral visualization.
Color Candles
Shows or hides candle coloring based on the current signal.
Count Length
Controls how much price history is used for the high, low, and close comparisons.
Long Threshold
Controls the score required for the indicator to switch to a bullish condition.
Short Threshold
Controls the score required for the indicator to switch to a bearish condition.
✧ HOW IT WORKS ✧
HLC Comparison
Indicator compares current high, low, and close with their corresponding historical values over the selected lookback period.
Each time a current value is above its historical value, comparison count increases.
Combined Score
High, low, and close comparison counts are combined and averaged into a single oscillator value.
Higher values indicate that the current HLC values are positioned above a larger portion of their recent history, while lower values indicate weaker relative price positioning.
Signal Logic
A bullish condition is activated when the oscillator rises above the Long Threshold.
A bearish condition is activated when the oscillator falls below the Short Threshold.
While the oscillator remains between two thresholds, previous condition stays active.
✧ VISUALIZATION ✧
Oscillator changes color based on the active condition:
Green represents a bullish condition.
Red represents a bearish condition.
Neutral mode displays the same conditions using light and dark shades.
The same colors can optionally be applied directly to the chart candles.
Plotted oscillator is capped slightly beyond the threshold levels to keep the relevant signal area in focus. This does not affect the underlying calculation or signal logic.
✧ USAGE ✧
HLC Oscillator can be used to identify:
Bullish and bearish price strength
Changes in relative price positioning
Potential directional shifts
Trend confirmation
Momentum context
Additional confirmation for other technical analysis
Indicator is designed to provide directional market context based on the relative position of current price values within their recent history.
As with any technical indicator, it is best used alongside other forms of analysis rather than as a standalone entry or exit signal.

Feragatname
Bilgiler ve yayınlar, TradingView tarafından sağlanan veya onaylanan finansal, yatırım, alım satım veya diğer türden tavsiye veya öneriler anlamına gelmez ve teşkil etmez. Kullanım Koşulları bölümünde daha fazlasını okuyun.
Feragatname
Bilgiler ve yayınlar, TradingView tarafından sağlanan veya onaylanan finansal, yatırım, alım satım veya diğer türden tavsiye veya öneriler anlamına gelmez ve teşkil etmez. Kullanım Koşulları bölümünde daha fazlasını okuyun.