MSnR CC Level [6 Types]
MSnR CC Level [6 Types]
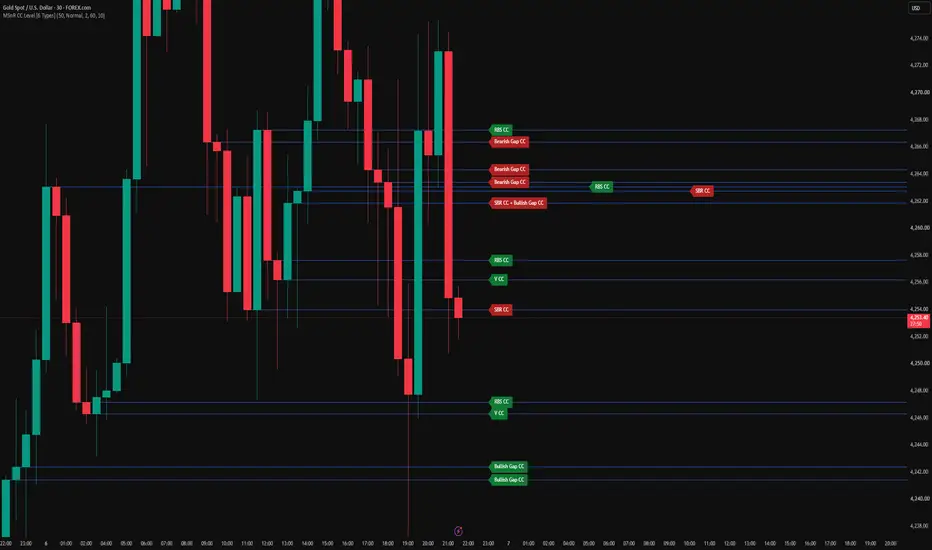
This script detects and maps Confirmation Candle (CC) levels, a 3-candle confirmation structure that checks whether a previously created level gets touched and rejected by the latest closed candle while keeping directional continuation.
Rather than looking at single swing points, CC detection requires a specific three-part pattern to validate a level. The result is a complete structural map of confirmed rejections inside the scan window, with each of the six CC types drawn so it can be told apart at a glance.
WHAT MAKES THIS DIFFERENT
1. Complete structural confirmation, not just arbitrary levels.
Most level tools draw lines where price has simply turned around. This tool requires a strict 3-candle structural proof. A level must be established, tested, and actively rejected with continuation to be drawn on the chart.
2. Identifies six distinct CC structures.
The script distinguishes between A CC, V CC, Bullish Gap CC, Bearish Gap CC, SBR CC, and RBS CC. The type is visually indicated, so you know exactly what structure formed the level without having to check the candles manually.
3. SBR and RBS are one-shot dynamic flips.
When an established level is broken, the script immediately starts looking for the very next candle to act as the signal candle, confirming a Support Become Resistance (SBR) or Resistance Become Support (RBS) setup.
THE SIX CC TYPES
A candle is Green when close is greater than or equal to open (a Doji counts as Green) and Red when close is less than open. The running candle is never used.
For the first four types, a 3-candle sequence is evaluated:
- Candle 1 establishes the reference level (the close of the first candle).
- Candle 2 provides the middle structure.
- Candle 3 is the signal candle that must reject the level and maintain directional strength.
V CC (Bullish)
Red, Green, Green. The signal candle low touches the V level, the body remains above it, and its close is greater than or equal to the middle candle's close.
Bullish Gap CC
Green, Green, Green. Follows the same touch, body, and continuation rules as the V CC.
A CC (Bearish)
Green, Red, Red. The signal candle high touches the A level, the body remains below it, and its close is less than or equal to the middle candle's close.
Bearish Gap CC
Red, Red, Red. Follows the same touch, body, and continuation rules as the A CC.
For the broken levels:
SBR CC
When a support level breaks down, the very next candle must act as the signal candle. It must reject the freshly flipped level from below, satisfying the same touch, body, and continuation rules as a bearish CC.
RBS CC
When a resistance level breaks up, the very next candle must act as the signal candle. It must reject the freshly flipped level from above, satisfying the same touch, body, and continuation rules as a bullish CC.
READING THE CHART
Colour tells you the side:
- Red labels: bearish rejections. A CC, Bearish Gap CC, SBR CC.
- Green labels: bullish rejections. V CC, Bullish Gap CC, RBS CC.
Each CC level starts at the candle that created its structure and extends to the right. The labels sit cleanly at the right edge of the chart to keep the price action visible. If multiple CC levels form at the same price, their labels are merged into a single entry to keep the chart clean. Nearby labels are automatically staggered horizontally to avoid overlap.
SETTINGS
Scan
- Scan Length (closed candles): how many closed candles are scanned backwards from the latest bar. Every CC Level found inside this window is drawn. The running candle is always excluded.
Display
- An individual switch for each of the six CC types, plus a toggle for the text labels.
Style
- Level Line Color, Label Size, and spacing options. You can adjust the distance used to merge same-price labels, the gap before staggering, and the horizontal stagger step.
ALERTS
Six alert conditions are available: A CC, V CC, Bullish Gap CC, Bearish Gap CC, SBR CC and RBS CC.
Each message carries the level type, the symbol, the timeframe and the closing price. The same messages are also sent through the alert function, so the "Any alert() function call" alert type can deliver everything through a single alert.
All alerts are evaluated only after a candle has fully closed.
REPAINTING
This script does not repaint.
- Detection reads confirmed candles only. The scan starts one bar behind the latest bar, so the candle that is still forming is never part of any calculation.
- Alert signals can only become true once a candle has finished. Price moving inside an open candle cannot make a signal appear and then disappear.
- Levels are rebuilt on the last bar from confirmed history. A level's price never moves. Once drawn, nothing shifts backwards.
When you create an alert, TradingView may show a caution banner saying the indicator can repaint. That banner appears automatically for any script that uses the built in bar state variables, no matter how they are used, because the platform cannot check the intent behind them. This script uses them for the opposite purpose: one of them is what restricts every signal to bar close, and the other is what redraws the levels efficiently on the final bar. Choosing "Once Per Bar Close" when creating the alert is still recommended.
NOTES AND LIMITATIONS
- TradingView caps drawings at 500 lines and 500 labels. A very long Scan Length will hit that ceiling and the oldest drawings will be dropped.
- The label offset and merge gap are measured in ticks. Expect to adjust these settings when moving between symbols with different tick values.
- Detection is purely structural. It reports where valid CC patterns have formed. It does not measure what happened afterwards, or produce entries, targets or stops.
HOW TO USE IT
Use these CC levels to map where the market has shown confirmed structural rejection. Areas where multiple CC structures stack together often represent stronger zones of interest.
These are reference areas, not automated entry signals. Use them alongside higher timeframe structure, and apply your own confirmation and risk management.
DISCLAIMER
This indicator is a level detection tool. It is not financial advice and it makes no claim about profitability. Trading involves risk. Always apply your own analysis and risk management.
This script detects and maps Confirmation Candle (CC) levels, a 3-candle confirmation structure that checks whether a previously created level gets touched and rejected by the latest closed candle while keeping directional continuation.
Rather than looking at single swing points, CC detection requires a specific three-part pattern to validate a level. The result is a complete structural map of confirmed rejections inside the scan window, with each of the six CC types drawn so it can be told apart at a glance.
WHAT MAKES THIS DIFFERENT
1. Complete structural confirmation, not just arbitrary levels.
Most level tools draw lines where price has simply turned around. This tool requires a strict 3-candle structural proof. A level must be established, tested, and actively rejected with continuation to be drawn on the chart.
2. Identifies six distinct CC structures.
The script distinguishes between A CC, V CC, Bullish Gap CC, Bearish Gap CC, SBR CC, and RBS CC. The type is visually indicated, so you know exactly what structure formed the level without having to check the candles manually.
3. SBR and RBS are one-shot dynamic flips.
When an established level is broken, the script immediately starts looking for the very next candle to act as the signal candle, confirming a Support Become Resistance (SBR) or Resistance Become Support (RBS) setup.
THE SIX CC TYPES
A candle is Green when close is greater than or equal to open (a Doji counts as Green) and Red when close is less than open. The running candle is never used.
For the first four types, a 3-candle sequence is evaluated:
- Candle 1 establishes the reference level (the close of the first candle).
- Candle 2 provides the middle structure.
- Candle 3 is the signal candle that must reject the level and maintain directional strength.
V CC (Bullish)
Red, Green, Green. The signal candle low touches the V level, the body remains above it, and its close is greater than or equal to the middle candle's close.
Bullish Gap CC
Green, Green, Green. Follows the same touch, body, and continuation rules as the V CC.
A CC (Bearish)
Green, Red, Red. The signal candle high touches the A level, the body remains below it, and its close is less than or equal to the middle candle's close.
Bearish Gap CC
Red, Red, Red. Follows the same touch, body, and continuation rules as the A CC.
For the broken levels:
SBR CC
When a support level breaks down, the very next candle must act as the signal candle. It must reject the freshly flipped level from below, satisfying the same touch, body, and continuation rules as a bearish CC.
RBS CC
When a resistance level breaks up, the very next candle must act as the signal candle. It must reject the freshly flipped level from above, satisfying the same touch, body, and continuation rules as a bullish CC.
READING THE CHART
Colour tells you the side:
- Red labels: bearish rejections. A CC, Bearish Gap CC, SBR CC.
- Green labels: bullish rejections. V CC, Bullish Gap CC, RBS CC.
Each CC level starts at the candle that created its structure and extends to the right. The labels sit cleanly at the right edge of the chart to keep the price action visible. If multiple CC levels form at the same price, their labels are merged into a single entry to keep the chart clean. Nearby labels are automatically staggered horizontally to avoid overlap.
SETTINGS
Scan
- Scan Length (closed candles): how many closed candles are scanned backwards from the latest bar. Every CC Level found inside this window is drawn. The running candle is always excluded.
Display
- An individual switch for each of the six CC types, plus a toggle for the text labels.
Style
- Level Line Color, Label Size, and spacing options. You can adjust the distance used to merge same-price labels, the gap before staggering, and the horizontal stagger step.
ALERTS
Six alert conditions are available: A CC, V CC, Bullish Gap CC, Bearish Gap CC, SBR CC and RBS CC.
Each message carries the level type, the symbol, the timeframe and the closing price. The same messages are also sent through the alert function, so the "Any alert() function call" alert type can deliver everything through a single alert.
All alerts are evaluated only after a candle has fully closed.
REPAINTING
This script does not repaint.
- Detection reads confirmed candles only. The scan starts one bar behind the latest bar, so the candle that is still forming is never part of any calculation.
- Alert signals can only become true once a candle has finished. Price moving inside an open candle cannot make a signal appear and then disappear.
- Levels are rebuilt on the last bar from confirmed history. A level's price never moves. Once drawn, nothing shifts backwards.
When you create an alert, TradingView may show a caution banner saying the indicator can repaint. That banner appears automatically for any script that uses the built in bar state variables, no matter how they are used, because the platform cannot check the intent behind them. This script uses them for the opposite purpose: one of them is what restricts every signal to bar close, and the other is what redraws the levels efficiently on the final bar. Choosing "Once Per Bar Close" when creating the alert is still recommended.
NOTES AND LIMITATIONS
- TradingView caps drawings at 500 lines and 500 labels. A very long Scan Length will hit that ceiling and the oldest drawings will be dropped.
- The label offset and merge gap are measured in ticks. Expect to adjust these settings when moving between symbols with different tick values.
- Detection is purely structural. It reports where valid CC patterns have formed. It does not measure what happened afterwards, or produce entries, targets or stops.
HOW TO USE IT
Use these CC levels to map where the market has shown confirmed structural rejection. Areas where multiple CC structures stack together often represent stronger zones of interest.
These are reference areas, not automated entry signals. Use them alongside higher timeframe structure, and apply your own confirmation and risk management.
DISCLAIMER
This indicator is a level detection tool. It is not financial advice and it makes no claim about profitability. Trading involves risk. Always apply your own analysis and risk management.

Explore more trading tools & resources on my official website: rwbtradelab.com | Telegram: t.me/rwbtradelab
Feragatname
Bilgiler ve yayınlar, TradingView tarafından sağlanan veya onaylanan finansal, yatırım, alım satım veya diğer türden tavsiye veya öneriler anlamına gelmez ve teşkil etmez. Kullanım Koşulları bölümünde daha fazlasını okuyun.
Explore more trading tools & resources on my official website: rwbtradelab.com | Telegram: t.me/rwbtradelab
Feragatname
Bilgiler ve yayınlar, TradingView tarafından sağlanan veya onaylanan finansal, yatırım, alım satım veya diğer türden tavsiye veya öneriler anlamına gelmez ve teşkil etmez. Kullanım Koşulları bölümünde daha fazlasını okuyun.