OPEN-SOURCE SCRIPT
ZenAlgo - Doji
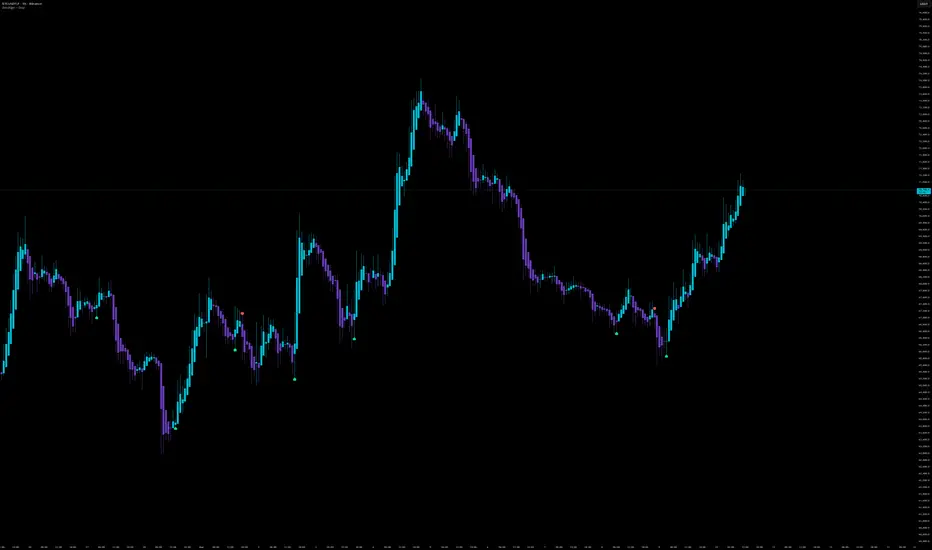
Overview
This indicator identifies Doji candles and adds two contextual filters before creating an alert: a relative volume expansion filter and a normalized directional-shift filter. Most Doji indicators simply detect candle shape. This script instead adds contextual conditions so that alerts appear only when the Doji occurs together with increased participation and a change in short-term directional pressure.
Doji candles appear frequently on their own, so the script focuses on situations where candle balance, elevated activity, and a directional shift occur at the same time.
How the indicator works
The script begins by evaluating candle structure. It measures the full candle range, the size of the body, and the size of the upper and lower wicks relative to the entire candle. A candle is considered a Doji when the body occupies only a small portion of the range.
After identifying the base Doji structure, the candle is classified into one of several common Doji types depending on the relative size of the wicks:
A Doji indicates that price moved during the bar but finished close to the opening level, suggesting temporary balance between buyers and sellers.
Volume context (PVSRA-style comparison)
After the candle structure is detected, the script evaluates trading activity.
Current volume is compared with the average volume over a recent lookback window. If current volume exceeds that average by a configurable multiple, the candle is considered to occur during elevated participation.
This step is important because a Doji formed during low activity may simply reflect quiet trading, while a Doji formed during higher participation means more trading occurred but the candle still closed near equilibrium.
Normalized price-change proxy
The script then evaluates short-term directional behavior.
It measures the percentage change between consecutive closing prices. This series is smoothed to reduce noise and then normalized relative to recent behavior. The normalization allows the script to determine whether the current directional movement is unusually positive or negative compared with recent activity.
The script compares this normalized value with the previous bar. An alert requires the value to change sign between the two bars, which indicates that the short-term directional pressure has flipped.
Why the components are combined
Each component describes a different aspect of market behavior:
Basic Doji markers highlight every small-body candle. This indicator is more selective because it only highlights cases where equilibrium, participation, and directional change appear together.
Final alert logic
An alert is created when the following conditions occur simultaneously:
Alerts are separated into bullish and bearish categories according to the direction of the normalized reading after the flip.
How to interpret the alerts
A bullish alert means the script detected a Doji context with elevated volume and a positive directional flip.
A bearish alert means the same conditions occurred with a negative directional flip.
The alert marks a moment where price equilibrium, increased participation, and directional change appeared together. These conditions may appear near short-term transitions, pauses, or local turning points.
How to use the indicator
This indicator is intended as a contextual chart tool rather than a standalone trading system.
Why Heikin Ashi often works well
The script can be used on any chart type, but Doji detection often becomes clearer on Heikin Ashi candles.
Heikin Ashi candles smooth short-term price fluctuations by averaging values from multiple bars. Because the indicator relies on candle body and wick proportions, this smoothing reduces small random Doji created by short-term noise and produces clearer candle structures.
Limitations
The indicator highlights situations where candle equilibrium, elevated participation, and directional change appear together, but it does not determine future price direction.
This indicator identifies Doji candles and adds two contextual filters before creating an alert: a relative volume expansion filter and a normalized directional-shift filter. Most Doji indicators simply detect candle shape. This script instead adds contextual conditions so that alerts appear only when the Doji occurs together with increased participation and a change in short-term directional pressure.
Doji candles appear frequently on their own, so the script focuses on situations where candle balance, elevated activity, and a directional shift occur at the same time.
How the indicator works
The script begins by evaluating candle structure. It measures the full candle range, the size of the body, and the size of the upper and lower wicks relative to the entire candle. A candle is considered a Doji when the body occupies only a small portion of the range.
After identifying the base Doji structure, the candle is classified into one of several common Doji types depending on the relative size of the wicks:
- Dragonfly Doji – very small upper wick and long lower wick.
- Gravestone Doji – very small lower wick and long upper wick.
- Long-legged Doji – both wicks are relatively long.
- Standard Doji – small body without the extreme wick proportions of the other types.
A Doji indicates that price moved during the bar but finished close to the opening level, suggesting temporary balance between buyers and sellers.
Volume context (PVSRA-style comparison)
After the candle structure is detected, the script evaluates trading activity.
Current volume is compared with the average volume over a recent lookback window. If current volume exceeds that average by a configurable multiple, the candle is considered to occur during elevated participation.
This step is important because a Doji formed during low activity may simply reflect quiet trading, while a Doji formed during higher participation means more trading occurred but the candle still closed near equilibrium.
Normalized price-change proxy
The script then evaluates short-term directional behavior.
It measures the percentage change between consecutive closing prices. This series is smoothed to reduce noise and then normalized relative to recent behavior. The normalization allows the script to determine whether the current directional movement is unusually positive or negative compared with recent activity.
The script compares this normalized value with the previous bar. An alert requires the value to change sign between the two bars, which indicates that the short-term directional pressure has flipped.
Why the components are combined
Each component describes a different aspect of market behavior:
- The Doji describes temporary balance inside a candle.
- The volume comparison measures whether that balance occurred during elevated participation.
- The directional flip indicates a shift in short-term pressure.
Basic Doji markers highlight every small-body candle. This indicator is more selective because it only highlights cases where equilibrium, participation, and directional change appear together.
Final alert logic
An alert is created when the following conditions occur simultaneously:
- A Doji is present on the current candle or the previous candle.
- Volume exceeds the recent average by the configured multiple when the volume filter is enabled.
- The normalized directional reading flips sign between two consecutive bars.
Alerts are separated into bullish and bearish categories according to the direction of the normalized reading after the flip.
How to interpret the alerts
A bullish alert means the script detected a Doji context with elevated volume and a positive directional flip.
A bearish alert means the same conditions occurred with a negative directional flip.
The alert marks a moment where price equilibrium, increased participation, and directional change appeared together. These conditions may appear near short-term transitions, pauses, or local turning points.
How to use the indicator
This indicator is intended as a contextual chart tool rather than a standalone trading system.
- Use alerts to locate Doji candles confirmed by participation and directional change.
- Interpret bullish alerts as possible upward transitions and bearish alerts as possible downward transitions.
- Evaluate the alert location relative to support, resistance, or recent trend structure.
- Combine the alerts with other analysis tools or higher timeframe context.
Why Heikin Ashi often works well
The script can be used on any chart type, but Doji detection often becomes clearer on Heikin Ashi candles.
Heikin Ashi candles smooth short-term price fluctuations by averaging values from multiple bars. Because the indicator relies on candle body and wick proportions, this smoothing reduces small random Doji created by short-term noise and produces clearer candle structures.
Limitations
- Doji candles occur frequently and do not inherently indicate reversals.
- Volume filters depend on the quality and meaning of the exchange’s volume data.
- The directional proxy is based on price changes rather than direct order flow.
- Different markets, timeframes, and preset settings can change how often alerts appear.
The indicator highlights situations where candle equilibrium, elevated participation, and directional change appear together, but it does not determine future price direction.
Açık kaynak kodlu komut dosyası
Gerçek TradingView ruhuyla, bu komut dosyasının mimarı, yatırımcıların işlevselliğini inceleyip doğrulayabilmesi için onu açık kaynaklı hale getirdi. Yazarı tebrik ederiz! Ücretsiz olarak kullanabilseniz de, kodu yeniden yayınlamanın Topluluk Kurallarımıza tabi olduğunu unutmayın.

The ZenAlgo team
zenalgo.com
discord.zenalgo.com
zenalgo.com
discord.zenalgo.com
Feragatname
Bilgiler ve yayınlar, TradingView tarafından sağlanan veya onaylanan finansal, yatırım, alım satım veya diğer türden tavsiye veya öneriler anlamına gelmez ve teşkil etmez. Kullanım Koşulları bölümünde daha fazlasını okuyun.
Açık kaynak kodlu komut dosyası
Gerçek TradingView ruhuyla, bu komut dosyasının mimarı, yatırımcıların işlevselliğini inceleyip doğrulayabilmesi için onu açık kaynaklı hale getirdi. Yazarı tebrik ederiz! Ücretsiz olarak kullanabilseniz de, kodu yeniden yayınlamanın Topluluk Kurallarımıza tabi olduğunu unutmayın.
The ZenAlgo team
zenalgo.com
discord.zenalgo.com
zenalgo.com
discord.zenalgo.com
Feragatname
Bilgiler ve yayınlar, TradingView tarafından sağlanan veya onaylanan finansal, yatırım, alım satım veya diğer türden tavsiye veya öneriler anlamına gelmez ve teşkil etmez. Kullanım Koşulları bölümünde daha fazlasını okuyun.