OPEN-SOURCE SCRIPT
Monthly Seasonal Anomaly (TrimmedMean,forcast)
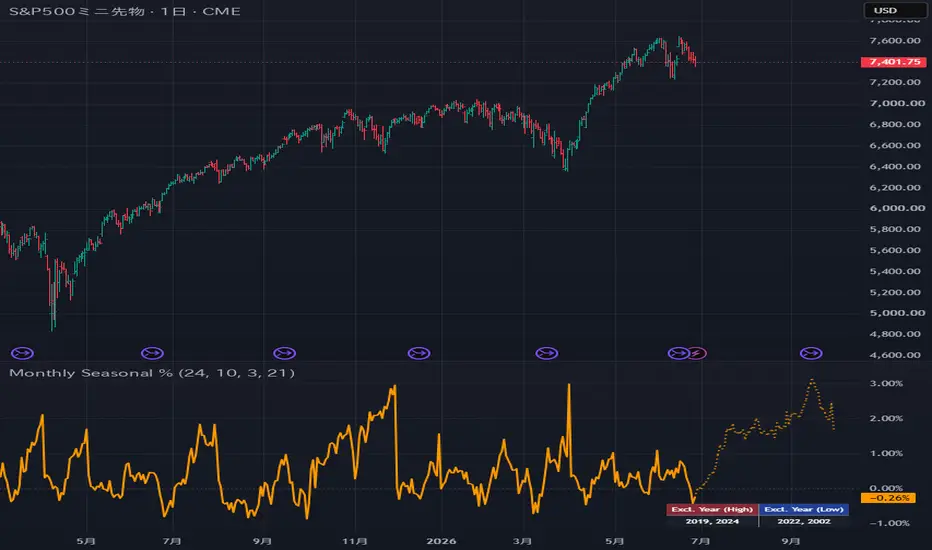
When analyzing seasonality, the issue of "outlier years" inevitably arises.
As a potential solution, I have utilized a trimmed mean approach.
While the reference values are still under consideration, I have designed the parameters to be fully customizable, and I hope this proves useful for your research.
・Indicator Overview
This script is a projection tool that extracts "monthly price fluctuation seasonality" from historical market data and plots a predicted trajectory for the next three months. Unlike a simple historical average, it features "cross-filtering" capabilities that automatically detect and exclude macroeconomic outliers (years marked by extreme crashes or surges).
・Core Architecture (Trimming Mechanism)
Instead of a standard "trimmed mean," this indicator incorporates a "cross-filtering" logic (annual assessment followed by monthly exclusion).
1. Rationale for Annual Exclusion
Consider a scenario where the market experienced a historic crash in October 2008 (the Lehman Shock). If this were included in the monthly average as an "October anomaly" (implying a general tendency for prices to fall in October), it would significantly distort statistics based on normal market conditions. This is because the event represents an "annual anomaly" rather than a "monthly anomaly."
2. Two-Step Trimming Process
The indicator eliminates noise through the following process:
Phase 1 (Identifying Anomaly Years):
First, the script calculates the "Year-to-Date (YTD) rate of change" for each year in the background and ranks them. Based on a configurable percentage (default: 10%), it identifies years with extreme gains (Top) and extreme losses (Bottom) and adds them to an "Excluded Years" list.
Phase 2 (Refined Monthly Calculation):
When calculating monthly seasonality (e.g., the March anomaly), any years blacklisted during Phase 1 are skipped in the calculation. This approach aims to isolate "pure seasonality" observed during normal market conditions.
You can verify exactly which years were excluded by checking the information table at the bottom right.
3. Compounding Chain Across Months
For the forecast line covering the next three months, we have moved away from simply connecting the monthly averages.
Instead, we use the "projected closing level for the current month" as a baseline and apply a compounding calculation using the "seasonal average rate of change" for the following month. This method differs from the calculation used for historical bars; it eliminates discontinuities at month-end transitions, resulting in a smooth projection line that flows continuously from the current price into the future.
・Intended Use Cases
Use Case 1: Trend-Following Market Context Analysis (Reinforcing Your Edge)
The seasonal line serves as a filter to gauge the "underlying market sentiment."
For example, suppose your primary trading strategy involves buying on a MACD "golden cross." If the future forecast line indicates a "gradual upward trend over the next two months," this provides additional support for your decision. Conversely, if the data shows that "next month is historically prone to a deep correction," you can use this as a risk management filter—deciding, for instance, to skip the trade or halve your position size.
Use Case 2: Swing Trading – Profit Taking and Position Adjustment
Since the tool plots a projection for the next three months, it offers a guideline on "how long to hold a position for a statistical advantage."
If you hold a long position and the forecast line traces an arc that "peaks between the latter half of the current month and the early part of the next month before declining," you can plan to take profits in stages (scaling out) as the price approaches that peak.
Use Case 3: Detecting Divergence from Current Market Action (Breakdown of Anomalies)
By enabling the "Show Current Month Line" setting, the actual price movement for the current year is overlaid as a white line. If there is a significant divergence between the historical average during normal market conditions (orange line) and this year's trend (white line), it provides a crucial insight: the market has entered a regime—or trading environment—where the usual seasonal cycle no longer applies. This serves as a basis for deciding to switch from a seasonal strategy to an alternative approach, such as a momentum breakout strategy.
A note on parameter adjustment:
The number of trading days varies depending on the market in question (e.g., stock indices, commodities, or cryptocurrencies). By adjusting the "Bars per Month (Days)" setting—typically to around 21 for stocks and forex, or 30 for cryptocurrencies—you can more accurately align the X-axis (time axis) of the future projection line with the chart.
As a potential solution, I have utilized a trimmed mean approach.
While the reference values are still under consideration, I have designed the parameters to be fully customizable, and I hope this proves useful for your research.
・Indicator Overview
This script is a projection tool that extracts "monthly price fluctuation seasonality" from historical market data and plots a predicted trajectory for the next three months. Unlike a simple historical average, it features "cross-filtering" capabilities that automatically detect and exclude macroeconomic outliers (years marked by extreme crashes or surges).
・Core Architecture (Trimming Mechanism)
Instead of a standard "trimmed mean," this indicator incorporates a "cross-filtering" logic (annual assessment followed by monthly exclusion).
1. Rationale for Annual Exclusion
Consider a scenario where the market experienced a historic crash in October 2008 (the Lehman Shock). If this were included in the monthly average as an "October anomaly" (implying a general tendency for prices to fall in October), it would significantly distort statistics based on normal market conditions. This is because the event represents an "annual anomaly" rather than a "monthly anomaly."
2. Two-Step Trimming Process
The indicator eliminates noise through the following process:
Phase 1 (Identifying Anomaly Years):
First, the script calculates the "Year-to-Date (YTD) rate of change" for each year in the background and ranks them. Based on a configurable percentage (default: 10%), it identifies years with extreme gains (Top) and extreme losses (Bottom) and adds them to an "Excluded Years" list.
Phase 2 (Refined Monthly Calculation):
When calculating monthly seasonality (e.g., the March anomaly), any years blacklisted during Phase 1 are skipped in the calculation. This approach aims to isolate "pure seasonality" observed during normal market conditions.
You can verify exactly which years were excluded by checking the information table at the bottom right.
3. Compounding Chain Across Months
For the forecast line covering the next three months, we have moved away from simply connecting the monthly averages.
Instead, we use the "projected closing level for the current month" as a baseline and apply a compounding calculation using the "seasonal average rate of change" for the following month. This method differs from the calculation used for historical bars; it eliminates discontinuities at month-end transitions, resulting in a smooth projection line that flows continuously from the current price into the future.
・Intended Use Cases
Use Case 1: Trend-Following Market Context Analysis (Reinforcing Your Edge)
The seasonal line serves as a filter to gauge the "underlying market sentiment."
For example, suppose your primary trading strategy involves buying on a MACD "golden cross." If the future forecast line indicates a "gradual upward trend over the next two months," this provides additional support for your decision. Conversely, if the data shows that "next month is historically prone to a deep correction," you can use this as a risk management filter—deciding, for instance, to skip the trade or halve your position size.
Use Case 2: Swing Trading – Profit Taking and Position Adjustment
Since the tool plots a projection for the next three months, it offers a guideline on "how long to hold a position for a statistical advantage."
If you hold a long position and the forecast line traces an arc that "peaks between the latter half of the current month and the early part of the next month before declining," you can plan to take profits in stages (scaling out) as the price approaches that peak.
Use Case 3: Detecting Divergence from Current Market Action (Breakdown of Anomalies)
By enabling the "Show Current Month Line" setting, the actual price movement for the current year is overlaid as a white line. If there is a significant divergence between the historical average during normal market conditions (orange line) and this year's trend (white line), it provides a crucial insight: the market has entered a regime—or trading environment—where the usual seasonal cycle no longer applies. This serves as a basis for deciding to switch from a seasonal strategy to an alternative approach, such as a momentum breakout strategy.
A note on parameter adjustment:
The number of trading days varies depending on the market in question (e.g., stock indices, commodities, or cryptocurrencies). By adjusting the "Bars per Month (Days)" setting—typically to around 21 for stocks and forex, or 30 for cryptocurrencies—you can more accurately align the X-axis (time axis) of the future projection line with the chart.
Açık kaynak kodlu komut dosyası
Gerçek TradingView ruhuyla, bu komut dosyasının mimarı, yatırımcıların işlevselliğini inceleyip doğrulayabilmesi için onu açık kaynaklı hale getirdi. Yazarı tebrik ederiz! Ücretsiz olarak kullanabilseniz de, kodu yeniden yayınlamanın Topluluk Kurallarımıza tabi olduğunu unutmayın.

Feragatname
Bilgiler ve yayınlar, TradingView tarafından sağlanan veya onaylanan finansal, yatırım, alım satım veya diğer türden tavsiye veya öneriler anlamına gelmez ve teşkil etmez. Kullanım Koşulları bölümünde daha fazlasını okuyun.
Açık kaynak kodlu komut dosyası
Gerçek TradingView ruhuyla, bu komut dosyasının mimarı, yatırımcıların işlevselliğini inceleyip doğrulayabilmesi için onu açık kaynaklı hale getirdi. Yazarı tebrik ederiz! Ücretsiz olarak kullanabilseniz de, kodu yeniden yayınlamanın Topluluk Kurallarımıza tabi olduğunu unutmayın.
Feragatname
Bilgiler ve yayınlar, TradingView tarafından sağlanan veya onaylanan finansal, yatırım, alım satım veya diğer türden tavsiye veya öneriler anlamına gelmez ve teşkil etmez. Kullanım Koşulları bölümünde daha fazlasını okuyun.