Cumulative Relative Volume (RVol)
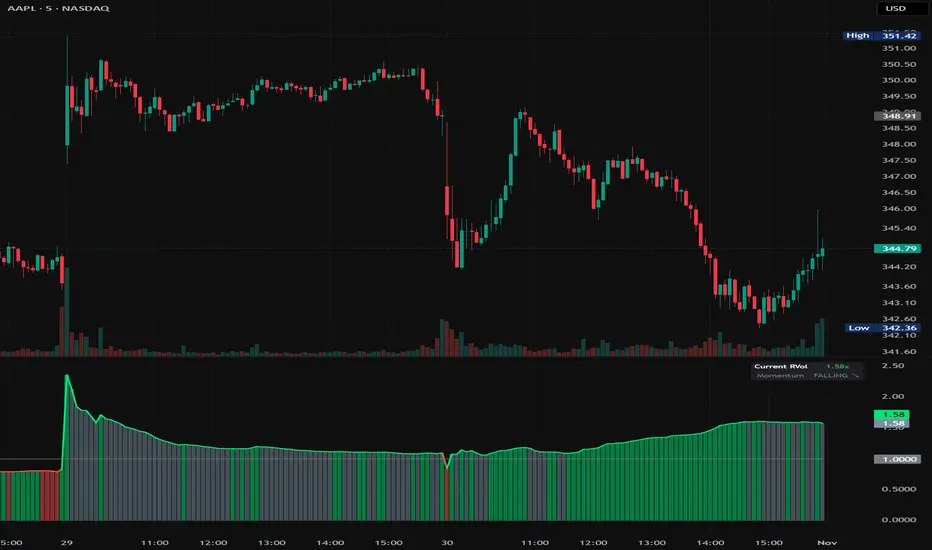
Cumulative Relative Volume (RVol)
Most relative volume tools compare a finished bar against a finished average. This indicator compares the volume traded so far in the session against what the same point of the session usually produces, so the reading is available from the open instead of only after the close.
How it works
For every bar of the trading day the script keeps one row of a rolling matrix, and each column holds one past session's cumulative volume at that same bar of the day. The mean of those sessions is the expected cumulative volume:
RVol = current cumulative volume / expected cumulative volume
Past-session values are written only on confirmed bars, so the historical series does not shift when new data arrives. The newest bar keeps updating with live volume.
Display modes
Volume Comparison (Histogram)
- Running session volume as columns, average running volume as a line.
- The volume difference against the average is printed in the info table.
RVol Ratio (Histogram + Line)
- The ratio as a histogram plus a trend line, with a 1.0x baseline.
- Histogram: green while the ratio is rising, slate above 1.0x while fading, red below 1.0x.
- Line: green at or above 1.0x, red below.
Inputs
- Display Mode: selects one of the two panels above.
- Lookback Days: number of past sessions in the average (2-50, default 10).
Notes
- Built for intraday charts of 1 minute or slower. The slot table holds 1440 rows, a full 24-hour day at 1-minute resolution.
- The session boundary follows timeframe.change("D"). On instruments whose session crosses midnight, the counter restarts at midnight rather than at the session open.
- Until Lookback Days sessions have accumulated, the average uses only the sessions available, so the ratio starts at 1.0x.
- On daily and higher timeframes the script falls back to volume / SMA(volume, Lookback Days).
Most relative volume tools compare a finished bar against a finished average. This indicator compares the volume traded so far in the session against what the same point of the session usually produces, so the reading is available from the open instead of only after the close.
How it works
For every bar of the trading day the script keeps one row of a rolling matrix, and each column holds one past session's cumulative volume at that same bar of the day. The mean of those sessions is the expected cumulative volume:
RVol = current cumulative volume / expected cumulative volume
Past-session values are written only on confirmed bars, so the historical series does not shift when new data arrives. The newest bar keeps updating with live volume.
Display modes
Volume Comparison (Histogram)
- Running session volume as columns, average running volume as a line.
- The volume difference against the average is printed in the info table.
RVol Ratio (Histogram + Line)
- The ratio as a histogram plus a trend line, with a 1.0x baseline.
- Histogram: green while the ratio is rising, slate above 1.0x while fading, red below 1.0x.
- Line: green at or above 1.0x, red below.
Inputs
- Display Mode: selects one of the two panels above.
- Lookback Days: number of past sessions in the average (2-50, default 10).
Notes
- Built for intraday charts of 1 minute or slower. The slot table holds 1440 rows, a full 24-hour day at 1-minute resolution.
- The session boundary follows timeframe.change("D"). On instruments whose session crosses midnight, the counter restarts at midnight rather than at the session open.
- Until Lookback Days sessions have accumulated, the average uses only the sessions available, so the ratio starts at 1.0x.
- On daily and higher timeframes the script falls back to volume / SMA(volume, Lookback Days).

Feragatname
Bilgiler ve yayınlar, TradingView tarafından sağlanan veya onaylanan finansal, yatırım, alım satım veya diğer türden tavsiye veya öneriler anlamına gelmez ve teşkil etmez. Kullanım Koşulları bölümünde daha fazlasını okuyun.
Feragatname
Bilgiler ve yayınlar, TradingView tarafından sağlanan veya onaylanan finansal, yatırım, alım satım veya diğer türden tavsiye veya öneriler anlamına gelmez ve teşkil etmez. Kullanım Koşulları bölümünde daha fazlasını okuyun.