OPEN-SOURCE SCRIPT
AK - DCA Calculator
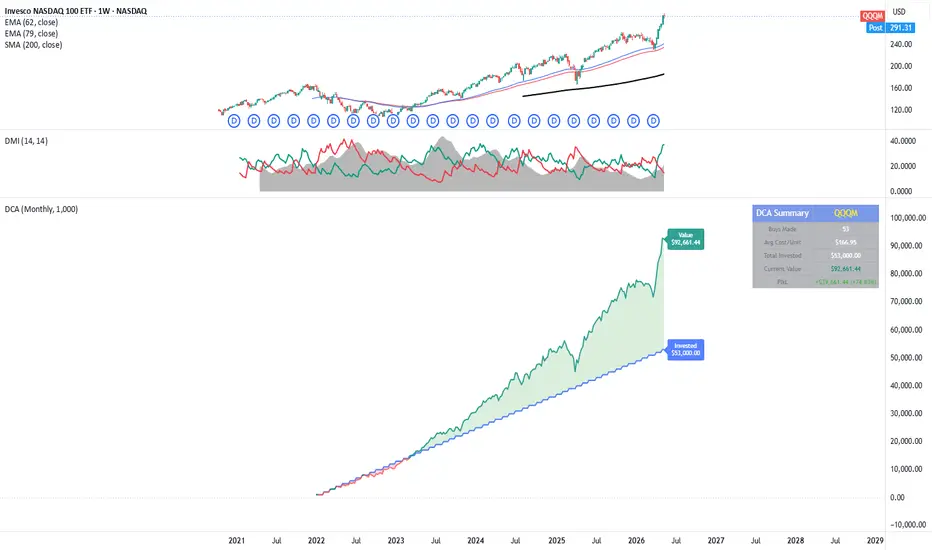
This indicator visualizes your Dollar Cost Averaging (DCA) strategy directly on your chart — no backtesting, no strategy tester, just a clean plot showing exactly where your money stands today.
What it does
Set your start date, buy frequency, and investment amount — the indicator calculates how many units you would have accumulated through consistent DCA purchases, then plots your total invested capital against your current portfolio value in a separate pane below the chart.
Features
📅 Configurable start date — model your DCA from any point in history
🔁 Three buy frequencies — Daily, Weekly, or Monthly
💵 Custom investment amount per purchase
📊 Separate pane — does not clutter your main price chart
🟢 Green fill when you're in profit, red fill when underwater
🏷️ Live labels on the last bar showing exact invested vs. current value
📋 Summary table (top-right) showing: buys made, average cost per unit, total invested, current portfolio value, and P&L in both $ and %
🎨 Fully customizable colors for all plot elements
How to use
Add the indicator to any ticker
Open Settings and set your Start Date, Buy Frequency, and Amount per Purchase
Best used on a Daily or Weekly chart for accurate frequency simulation
Works on any asset — stocks, crypto, forex, indices.
What it does
Set your start date, buy frequency, and investment amount — the indicator calculates how many units you would have accumulated through consistent DCA purchases, then plots your total invested capital against your current portfolio value in a separate pane below the chart.
Features
📅 Configurable start date — model your DCA from any point in history
🔁 Three buy frequencies — Daily, Weekly, or Monthly
💵 Custom investment amount per purchase
📊 Separate pane — does not clutter your main price chart
🟢 Green fill when you're in profit, red fill when underwater
🏷️ Live labels on the last bar showing exact invested vs. current value
📋 Summary table (top-right) showing: buys made, average cost per unit, total invested, current portfolio value, and P&L in both $ and %
🎨 Fully customizable colors for all plot elements
How to use
Add the indicator to any ticker
Open Settings and set your Start Date, Buy Frequency, and Amount per Purchase
Best used on a Daily or Weekly chart for accurate frequency simulation
Works on any asset — stocks, crypto, forex, indices.
Açık kaynak kodlu komut dosyası
Gerçek TradingView ruhuyla, bu komut dosyasının mimarı, yatırımcıların işlevselliğini inceleyip doğrulayabilmesi için onu açık kaynaklı hale getirdi. Yazarı tebrik ederiz! Ücretsiz olarak kullanabilseniz de, kodu yeniden yayınlamanın Topluluk Kurallarımıza tabi olduğunu unutmayın.

Feragatname
Bilgiler ve yayınlar, TradingView tarafından sağlanan veya onaylanan finansal, yatırım, alım satım veya diğer türden tavsiye veya öneriler anlamına gelmez ve teşkil etmez. Kullanım Koşulları bölümünde daha fazlasını okuyun.
Açık kaynak kodlu komut dosyası
Gerçek TradingView ruhuyla, bu komut dosyasının mimarı, yatırımcıların işlevselliğini inceleyip doğrulayabilmesi için onu açık kaynaklı hale getirdi. Yazarı tebrik ederiz! Ücretsiz olarak kullanabilseniz de, kodu yeniden yayınlamanın Topluluk Kurallarımıza tabi olduğunu unutmayın.
Feragatname
Bilgiler ve yayınlar, TradingView tarafından sağlanan veya onaylanan finansal, yatırım, alım satım veya diğer türden tavsiye veya öneriler anlamına gelmez ve teşkil etmez. Kullanım Koşulları bölümünde daha fazlasını okuyun.