Güncellendi
Volatility Cooldown Planner [AGPro Series]
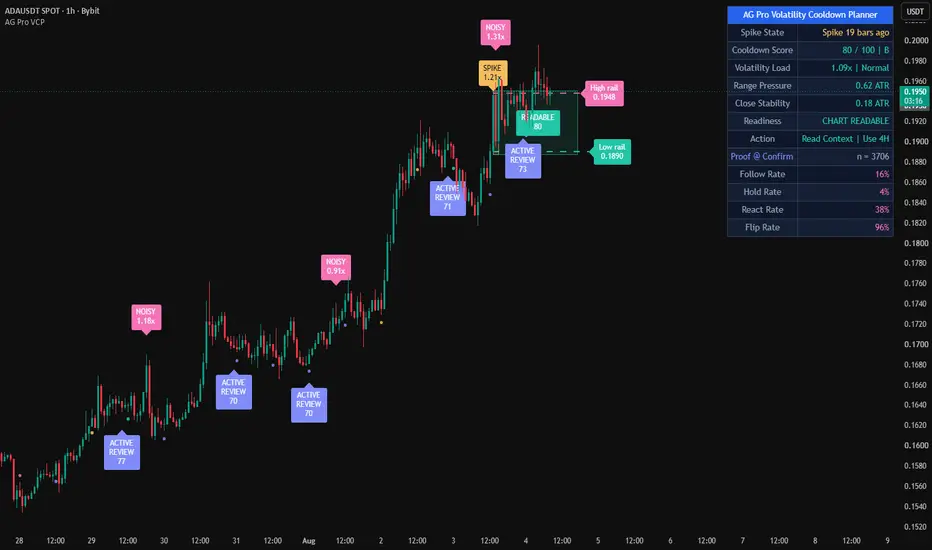
Volatility Cooldown Planner [AGPro Series]
🧠 Core Idea
Has volatility cooled down enough to read the chart again?
📌 Overview / What it does
Volatility Cooldown Planner [AGPro Series] is a chart-first volatility risk and readiness tool built for the period after a sharp ATR spike, wide-range candle, or large wick event.
Instead of printing another directional signal, the script asks whether the market is still unstable, cooling, ready for review, or readable again. It produces a spike box, a forward cooldown band, spike rails, unsafe volatility warnings, readiness labels, alerts, and a clean AGPro planning panel.
The script does not predict news events, identify hidden catalysts, automate decisions, or tell users what to buy or sell. Its role is to organize post-spike volatility context into a readable decision workflow.
🎯 Purpose & Design Philosophy
This script was built for traders who often face the same problem after sudden volatility: the chart is active, but not always readable.
Many tools focus on volatility expansion, squeeze release, regime classification, or breakout confirmation. Those can be useful, but they do not always answer the practical question that appears after a spike: should the trader keep reading this structure now, or wait until volatility load normalizes?
The design philosophy is simple: after unstable volatility, the first decision is not direction. The first decision is whether the chart is clean enough to evaluate.
⚡ Why This Script Is Different
Most volatility tools focus on detecting expansion, squeeze release, high ATR regimes, or dramatic candles.
This script does NOT try to detect news events, does not clone a volatility expansion planner, does not act as a stop-run model, and does not classify broad volatility cycles.
Instead, it studies the cooling process after the spike. The main output is a 0-100 Cooldown Score and a next-action state that separates UNSAFE, TOO EARLY, COOLING, READINESS REVIEW, and CHART READABLE conditions.
⚙️ Methodology
1. Spike Detection
The engine identifies spike context using ATR Load, single-bar range expansion, and dominant wick size.
2. Cooldown Mapping
When a spike appears, the script draws a spike box and a forward cooldown band. The band becomes the active review area for post-spike readability.
3. Readiness Evaluation
The model scores ATR load normalization, range contraction, time decay, close-to-close stability, and wick pressure.
4. Visual Output
The planner displays the active state through labels, rails, band color, alert conditions, and a compact AGPro panel.
🗺️ How to Read the Chart
Spike Box = the original volatility shock area.
Cooldown Band = the forward review window where the script evaluates whether volatility is becoming readable again.
Spike Rails = the upper and lower reference boundaries from the spike event. They are volatility context rails, not entry or stop instructions.
Readability Trail = an optional lightweight dot layer for users who want extra chart presence between major labels. It is disabled by default for a cleaner publication preset.
Unsafe Label = volatility has reloaded before cooldown completed.
Ready / Readable Labels = the cooldown score has reached a stronger review state.
Panel = a compact decision view showing Spike State, Cooldown Score, Volatility Load, Readiness, Action, and Best View.
🚦 Signals & States
• SPIKE → a new volatility shock has been registered.
• UNSAFE → volatility reloaded before the cooldown process became stable.
• TOO EARLY → not enough bars have passed after the spike.
• COOLING → volatility is improving, but readiness is not strong enough yet.
• READINESS REVIEW → conditions are strong enough to review the chart again.
• CHART READABLE → ATR load has normalized and the cooldown score is strong.
🔔 Alerts Logic
Volatility Spike Registered triggers when ATR load, range expansion, or wick pressure qualifies as a spike event.
Unsafe Volatility Reload triggers when volatility expands again during the active cooldown window.
Cooldown Readiness Review triggers when the cooldown score reaches the readiness threshold.
Chart Readable After Cooldown triggers when volatility load and cooldown quality both reach the strongest readable state.
Alerts are attention markers, not trade instructions.
🧩 Confluence Logic
The strongest cooldown state appears when multiple conditions align:
ATR load falls toward the target area, recent ranges contract, close-to-close movement stabilizes, wick pressure fades, and enough time has passed after the spike.
When these conditions align, the chart becomes more readable under the script's rules. This does not create certainty or directional prediction.
📊 When to Use
• After sharp ATR spikes
• After wide-range candles
• After large wick events
• After fast liquidation-style movement
• During post-event stabilization
• When the chart feels too unstable to interpret cleanly
• Best visual fit: 4H charts and intraday-swing volatility review
• Daily charts can work for broader context, but they may look more sparse because fewer cooldown events appear
⚠️ When NOT to Use
• Very low-liquidity markets
• Illiquid sessions with unreliable candle structure
• Extreme news volatility where conditions keep changing quickly
• Symbols with irregular gaps or poor feed quality
• As a standalone directional entry system
🎛️ Key Inputs
• Sensitivity → controls how demanding spike detection is.
• ATR Length → normalizes spike size and label offsets.
• ATR Baseline Length → defines the local volatility baseline.
• Cooldown Review Window → controls how long the spike remains under review.
• Cooldown Target ATR Load → defines the internal volatility load target for readability.
• Readiness Score Threshold → defines when the panel can mark readiness review.
• Visual settings → control spike boxes, cooldown bands, rails, markers, and background warnings.
• Readability Trail → optional subtle chart presence during active cooldown or elevated volatility.
• Label and Panel Font Size → control chart labels and panel readability.
🖥️ Interface & Visual Design
The interface is designed to stay chart-first.
The spike box explains where the instability started. The cooldown band shows the active review window. The centered band label gives the current state without forcing the user into a lower-pane dashboard.
The default visual preset keeps the chart calmer by hiding standalone spike event labels, sparse context labels, label scores, readable-upgrade follow-up labels, and the optional readability trail. Users can enable those layers when they want a denser visual review.
The AGPro panel follows the public-release standard with one merged blue header row containing only the panel title. The remaining rows focus on decision context rather than raw data overload, including a Best View row that points users toward the 4H chart when needed.
🧪 Practical Usage Workflow
1. Read the panel Readiness and Action fields.
2. Start with a 4H chart when preparing a visual review or publication screenshot.
3. Check whether the chart is still inside an active cooldown band.
4. Watch Volatility Load and Cooldown Score.
5. Treat UNSAFE as a warning that the chart may still be unstable.
6. Treat READINESS REVIEW or CHART READABLE as a prompt to evaluate broader structure, not as an automatic trade command.
🔍 Interpretation Guidelines
A high cooldown score means volatility has normalized under the script's rule set.
It does not mean price must continue, reverse, or respect the spike rails.
The best use is as a readability filter after unstable movement. It helps the trader decide whether the market is still too hot, cooling, or clean enough to study again.
🚫 What This Script Is NOT
• Not a prediction engine
• Not financial advice
• Not auto trading
• Not guaranteed signals
• Not a news-event detector
• Not a volatility expansion breakout tool
• Not a stop-run or liquidity-sweep model
⚠️ Limitations & Transparency
This script uses standard TradingView OHLCV data and ATR-based measurements.
It cannot identify the real-world cause of volatility. It cannot know whether a spike came from news, liquidation, session flow, thin liquidity, or normal order flow.
Timeframe selection, symbol liquidity, session structure, and volatility regime can affect how quickly cooldown states appear. The default preset is visually best suited to 4H charts; lower timeframes may require stricter inputs, while Daily charts may naturally show fewer events.
🧠 Market Context Notes
Volatility often becomes hardest to interpret immediately after a sharp event.
Some spikes create clean follow-through. Others create unstable noise, whipsaw, or delayed normalization.
This planner focuses on the cooling process, not the directional outcome.
🧾 Use Case Examples
When a wide candle appears and the panel shows UNSAFE, the trader can wait for volatility load to normalize before interpreting follow-through.
When a spike box remains active but the score rises into READINESS REVIEW, the trader can compare the cooldown band with broader structure, trend, liquidity, and personal execution rules.
When the panel reaches CHART READABLE, the market is no longer classified as overheated by the script, but the user still needs independent context.
🧱 System Philosophy
AGPro tools are designed to convert market structure into decision context.
This script follows that philosophy by turning post-spike volatility into a readable workflow: identify the shock, monitor the cooldown, evaluate the readiness state, and avoid treating every fast move as immediately actionable.
🔐 Non-Promise Statement
No script can remove uncertainty.
No cooldown state guarantees that the next move will be clean.
The output is a structured analytical context, not certainty.
📉 Risk Disclosure
Trading involves risk.
Users are responsible for their own analysis, risk management, and decisions.
This script is for educational and analytical use only and does not provide financial advice.
📚 Educational Note
Use the planner to study how volatility behaves after spikes, how long different symbols take to normalize, and how readability changes across timeframes.
🧠 Core Idea
Has volatility cooled down enough to read the chart again?
📌 Overview / What it does
Volatility Cooldown Planner [AGPro Series] is a chart-first volatility risk and readiness tool built for the period after a sharp ATR spike, wide-range candle, or large wick event.
Instead of printing another directional signal, the script asks whether the market is still unstable, cooling, ready for review, or readable again. It produces a spike box, a forward cooldown band, spike rails, unsafe volatility warnings, readiness labels, alerts, and a clean AGPro planning panel.
The script does not predict news events, identify hidden catalysts, automate decisions, or tell users what to buy or sell. Its role is to organize post-spike volatility context into a readable decision workflow.
🎯 Purpose & Design Philosophy
This script was built for traders who often face the same problem after sudden volatility: the chart is active, but not always readable.
Many tools focus on volatility expansion, squeeze release, regime classification, or breakout confirmation. Those can be useful, but they do not always answer the practical question that appears after a spike: should the trader keep reading this structure now, or wait until volatility load normalizes?
The design philosophy is simple: after unstable volatility, the first decision is not direction. The first decision is whether the chart is clean enough to evaluate.
⚡ Why This Script Is Different
Most volatility tools focus on detecting expansion, squeeze release, high ATR regimes, or dramatic candles.
This script does NOT try to detect news events, does not clone a volatility expansion planner, does not act as a stop-run model, and does not classify broad volatility cycles.
Instead, it studies the cooling process after the spike. The main output is a 0-100 Cooldown Score and a next-action state that separates UNSAFE, TOO EARLY, COOLING, READINESS REVIEW, and CHART READABLE conditions.
⚙️ Methodology
1. Spike Detection
The engine identifies spike context using ATR Load, single-bar range expansion, and dominant wick size.
2. Cooldown Mapping
When a spike appears, the script draws a spike box and a forward cooldown band. The band becomes the active review area for post-spike readability.
3. Readiness Evaluation
The model scores ATR load normalization, range contraction, time decay, close-to-close stability, and wick pressure.
4. Visual Output
The planner displays the active state through labels, rails, band color, alert conditions, and a compact AGPro panel.
🗺️ How to Read the Chart
Spike Box = the original volatility shock area.
Cooldown Band = the forward review window where the script evaluates whether volatility is becoming readable again.
Spike Rails = the upper and lower reference boundaries from the spike event. They are volatility context rails, not entry or stop instructions.
Readability Trail = an optional lightweight dot layer for users who want extra chart presence between major labels. It is disabled by default for a cleaner publication preset.
Unsafe Label = volatility has reloaded before cooldown completed.
Ready / Readable Labels = the cooldown score has reached a stronger review state.
Panel = a compact decision view showing Spike State, Cooldown Score, Volatility Load, Readiness, Action, and Best View.
🚦 Signals & States
• SPIKE → a new volatility shock has been registered.
• UNSAFE → volatility reloaded before the cooldown process became stable.
• TOO EARLY → not enough bars have passed after the spike.
• COOLING → volatility is improving, but readiness is not strong enough yet.
• READINESS REVIEW → conditions are strong enough to review the chart again.
• CHART READABLE → ATR load has normalized and the cooldown score is strong.
🔔 Alerts Logic
Volatility Spike Registered triggers when ATR load, range expansion, or wick pressure qualifies as a spike event.
Unsafe Volatility Reload triggers when volatility expands again during the active cooldown window.
Cooldown Readiness Review triggers when the cooldown score reaches the readiness threshold.
Chart Readable After Cooldown triggers when volatility load and cooldown quality both reach the strongest readable state.
Alerts are attention markers, not trade instructions.
🧩 Confluence Logic
The strongest cooldown state appears when multiple conditions align:
ATR load falls toward the target area, recent ranges contract, close-to-close movement stabilizes, wick pressure fades, and enough time has passed after the spike.
When these conditions align, the chart becomes more readable under the script's rules. This does not create certainty or directional prediction.
📊 When to Use
• After sharp ATR spikes
• After wide-range candles
• After large wick events
• After fast liquidation-style movement
• During post-event stabilization
• When the chart feels too unstable to interpret cleanly
• Best visual fit: 4H charts and intraday-swing volatility review
• Daily charts can work for broader context, but they may look more sparse because fewer cooldown events appear
⚠️ When NOT to Use
• Very low-liquidity markets
• Illiquid sessions with unreliable candle structure
• Extreme news volatility where conditions keep changing quickly
• Symbols with irregular gaps or poor feed quality
• As a standalone directional entry system
🎛️ Key Inputs
• Sensitivity → controls how demanding spike detection is.
• ATR Length → normalizes spike size and label offsets.
• ATR Baseline Length → defines the local volatility baseline.
• Cooldown Review Window → controls how long the spike remains under review.
• Cooldown Target ATR Load → defines the internal volatility load target for readability.
• Readiness Score Threshold → defines when the panel can mark readiness review.
• Visual settings → control spike boxes, cooldown bands, rails, markers, and background warnings.
• Readability Trail → optional subtle chart presence during active cooldown or elevated volatility.
• Label and Panel Font Size → control chart labels and panel readability.
🖥️ Interface & Visual Design
The interface is designed to stay chart-first.
The spike box explains where the instability started. The cooldown band shows the active review window. The centered band label gives the current state without forcing the user into a lower-pane dashboard.
The default visual preset keeps the chart calmer by hiding standalone spike event labels, sparse context labels, label scores, readable-upgrade follow-up labels, and the optional readability trail. Users can enable those layers when they want a denser visual review.
The AGPro panel follows the public-release standard with one merged blue header row containing only the panel title. The remaining rows focus on decision context rather than raw data overload, including a Best View row that points users toward the 4H chart when needed.
🧪 Practical Usage Workflow
1. Read the panel Readiness and Action fields.
2. Start with a 4H chart when preparing a visual review or publication screenshot.
3. Check whether the chart is still inside an active cooldown band.
4. Watch Volatility Load and Cooldown Score.
5. Treat UNSAFE as a warning that the chart may still be unstable.
6. Treat READINESS REVIEW or CHART READABLE as a prompt to evaluate broader structure, not as an automatic trade command.
🔍 Interpretation Guidelines
A high cooldown score means volatility has normalized under the script's rule set.
It does not mean price must continue, reverse, or respect the spike rails.
The best use is as a readability filter after unstable movement. It helps the trader decide whether the market is still too hot, cooling, or clean enough to study again.
🚫 What This Script Is NOT
• Not a prediction engine
• Not financial advice
• Not auto trading
• Not guaranteed signals
• Not a news-event detector
• Not a volatility expansion breakout tool
• Not a stop-run or liquidity-sweep model
⚠️ Limitations & Transparency
This script uses standard TradingView OHLCV data and ATR-based measurements.
It cannot identify the real-world cause of volatility. It cannot know whether a spike came from news, liquidation, session flow, thin liquidity, or normal order flow.
Timeframe selection, symbol liquidity, session structure, and volatility regime can affect how quickly cooldown states appear. The default preset is visually best suited to 4H charts; lower timeframes may require stricter inputs, while Daily charts may naturally show fewer events.
🧠 Market Context Notes
Volatility often becomes hardest to interpret immediately after a sharp event.
Some spikes create clean follow-through. Others create unstable noise, whipsaw, or delayed normalization.
This planner focuses on the cooling process, not the directional outcome.
🧾 Use Case Examples
When a wide candle appears and the panel shows UNSAFE, the trader can wait for volatility load to normalize before interpreting follow-through.
When a spike box remains active but the score rises into READINESS REVIEW, the trader can compare the cooldown band with broader structure, trend, liquidity, and personal execution rules.
When the panel reaches CHART READABLE, the market is no longer classified as overheated by the script, but the user still needs independent context.
🧱 System Philosophy
AGPro tools are designed to convert market structure into decision context.
This script follows that philosophy by turning post-spike volatility into a readable workflow: identify the shock, monitor the cooldown, evaluate the readiness state, and avoid treating every fast move as immediately actionable.
🔐 Non-Promise Statement
No script can remove uncertainty.
No cooldown state guarantees that the next move will be clean.
The output is a structured analytical context, not certainty.
📉 Risk Disclosure
Trading involves risk.
Users are responsible for their own analysis, risk management, and decisions.
This script is for educational and analytical use only and does not provide financial advice.
📚 Educational Note
Use the planner to study how volatility behaves after spikes, how long different symbols take to normalize, and how readability changes across timeframes.
Sürüm Notları
UPDATE NOTES - V1.5This update focuses on adding a slightly stronger label presence while preserving the premium visual balance from V1.4.
The core purpose of the script remains unchanged.
This release improves how key cooldown moments are surfaced on the chart without returning to the heavier marker density tested in the prior visual pass.
This script continues to function as an analytical and visualization tool.
It does not attempt to predict price direction or provide guaranteed outcomes.
------------------------
What Changed
------------------------
* Restored sparse event labels by default
Major cooldown labels are now visible again by default so the chart carries more narrative energy in publication screenshots.
* Kept small markers disabled by default
The scattered marker layer remains optional, preserving a cleaner premium look.
* Slightly increased visible label capacity
The default label cap now allows a few more recent labels to stay on the chart without creating a crowded signal-printer feel.
* Tuned label pacing calmly
The default label cooldown remains restrained, so labels appear around meaningful cooldown moments instead of every minor fluctuation.
* Preserved V1.4 trail discipline
The readability trail still appears only during active cooldown windows, keeping the chart active but controlled.
------------------------
Visual Improvements
------------------------
* Added a modest amount of label presence for a less empty chart
* Preserved the clean zone-first visual hierarchy
* Avoided returning to the dense marker look from the earlier visual test
* Maintained centered cooldown-zone text for first-glance readability
------------------------
Interface & Usability
------------------------
* Event labels are now enabled by default for better public-release screenshots
* Label score text remains disabled by default to keep labels compact
* Small markers, spike labels, context labels, and readable-upgrade labels remain optional settings
* Panel controls, theme controls, location controls, and font-size controls remain unchanged
------------------------
Behavior Notes
------------------------
This update does not change the core analytical logic of the script.
The goal is to improve visual storytelling and label balance, not to introduce predictive behavior.
Users should interpret outputs the same way as before, but with a slightly richer default chart presentation.
------------------------
Limitations Reminder
------------------------
The script remains a rule-based analytical tool.
Volatility clustering, wide candles, wick behavior, liquidity changes, and timeframe differences may affect how cooldown states appear.
Outputs should always be interpreted within broader market context.
------------------------
Risk Reminder
------------------------
This script is for educational and analytical purposes only.
It does not provide financial advice or guaranteed trading outcomes.
Users remain responsible for their own decisions.
Sürüm Notları
UPDATE NOTES - Version 1.8This update focuses on spike rail readability and clearer visual anchoring.
The core purpose of the script remains unchanged.
Volatility Cooldown Planner continues to evaluate whether the market has cooled down after an ATR spike, wide-range candle, or large wick event.
This script remains an analytical and visualization tool.
It does not attempt to predict price direction or provide guaranteed outcomes.
------------------------
What Changed
------------------------
* Clearer spike rail tags
Spike high and spike low labels now read as HIGH RAIL and LOW RAIL, making their role clearer on the chart.
* Stronger rail connection
The active spike rails are now thicker, more visible, and extend directly into the right-edge rail tags.
* Cleaner historical behavior
Historical spike rail tags are not retained as orphan labels. Retained zones keep their own solid zone labels, while rail tags stay focused on the active cooldown context.
* Better dark-theme readability
Rail labels now feel attached to the visual reference level instead of floating near price.
------------------------
Visual Improvements
------------------------
* Improved chart readability by strengthening the active high / low rail lines.
* Reduced ambiguity around what the rail tags are pointing to.
* Kept retained spike and cooldown zone labels readable and premium.
* Reduced historical rail-tag clutter while preserving useful zone memory.
------------------------
Interface & Usability
------------------------
* Panel layout remains unchanged from V1.7.
* Rail tags now support interpretation instead of competing with zone labels.
* Default visual settings remain publication-friendly for 4H and 1D screenshots.
------------------------
Behavior Notes
------------------------
This update does not change the core analytical logic of the script.
The goal is to improve visual clarity and usability, not to introduce predictive behavior.
Users should interpret outputs the same way as before, but with clearer active rail references.
------------------------
Limitations Reminder
------------------------
The script remains a rule-based analytical tool.
Market conditions such as volatility clustering, low liquidity, timeframe selection, and symbol behavior may affect how cooldown states appear.
Outputs should always be interpreted within broader market context.
------------------------
Risk Reminder
------------------------
This script is for educational and analytical purposes only.
It does not provide financial advice or guaranteed trading outcomes.
Users remain responsible for their own decisions.
Sürüm Notları
UPDATE NOTES - V1.9This update focuses on publication polish, rail-tag spacing, panel placement flexibility, and safer panel header refresh behavior.
The core purpose of the script remains unchanged.
Volatility Cooldown Planner continues to evaluate whether the market has cooled down enough after an ATR spike, wide-range candle, or large wick event.
This script continues to function as an analytical and visualization tool.
It does not attempt to predict price direction or provide guaranteed outcomes.
------------------------
What Changed
------------------------
* Added rail-tag offset control
A new Rail Tag Offset Bars input allows the active high and low rail tags to be moved farther right when needed.
* Expanded panel location options
Panel placement now includes Middle Center in addition to the existing top, middle, and bottom placement options.
* Standardized panel refresh behavior
The panel now clears and rebuilds the merged blue header row during last-bar updates, keeping the panel header consistent with the AG Pro publication standard.
* Removed unused box text calls
The active spike and cooldown boxes now rely fully on solid labels and badges rather than box text handling.
* Preserved the cooldown engine
Spike detection, ATR load, range pressure, wick pressure, cooldown scoring, rails, zone badges, labels, alerts, data-window plots, and panel rows remain intact.
------------------------
Visual Improvements
------------------------
* Improved right-edge readability by giving spike rail tags configurable spacing.
* Reduced overlap risk between active high / low rail tags and the price scale.
* Preserved solid labels on retained spike and cooldown zones.
* Preserved the clean chart-first visual hierarchy built in the previous release.
------------------------
Interface & Usability
------------------------
* Added Rail Tag Offset Bars for chart-specific rail-tag placement.
* Added center panel placement flexibility.
* Preserved panel show/hide, theme, location, and font-size controls.
* Preserved label controls, rail controls, cooldown band controls, and readability trail settings.
------------------------
Behavior Notes
------------------------
This update does not change the core analytical logic of the script.
The goal is to improve clarity and usability, not to introduce new predictive behavior.
Users should interpret outputs the same way as before, but with better right-edge spacing and cleaner panel refresh behavior.
------------------------
Limitations Reminder
------------------------
The script remains a rule-based analytical tool.
Volatility clustering, wide candles, wick behavior, liquidity changes, and timeframe differences may affect how cooldown states appear.
Outputs should always be interpreted within broader market context.
------------------------
Risk Reminder
------------------------
This script is for educational and analytical purposes only.
It does not provide financial advice or guaranteed trading outcomes.
Users remain responsible for their own decisions.
Sürüm Notları
UPDATE NOTES - V2.0This update focuses on reduced on-chart density for a cleaner, more premium first-glance look.
The core purpose of the script remains unchanged.
This release lowers how many spike and cooldown structures are kept on the chart at once, so recent context stays clear without overlapping badges. It does not change the spike engine, the cooldown scoring, the readiness states, the rails, or the alerts.
This script continues to function as a chart-first volatility readiness and visualization tool. It does not attempt to predict price direction or provide guaranteed outcomes.
------------------------
What Changed
------------------------
- Single active cooldown zone
The chart now keeps only the most recent spike and cooldown zone by default, instead of stacking several at once. When spikes happen close together, their boxes and badges no longer overlap into a crowded cluster on the right edge.
- Fewer on-chart event labels
The default number of retained event labels was reduced so the chart shows the most recent context as a clean trail without crowding.
- Cleaner first glance
With one active zone plus a lighter event trail, the spike badge, the cooldown badge, and the high and low rail tags read as one coherent block instead of competing for space.
- No logic changes
The volatility spike engine, the ATR load, range, stability, and contraction measurements, the 0-100 cooldown score, the readiness states, and all alerts behave exactly as before. Users who prefer more history can raise Max Visible Zones and Max Visible Labels in the settings.
------------------------
Visual Improvements
------------------------
- Removed the overlapping zone pile-up on the right chart edge by keeping a single active cooldown zone.
- Lowered default label density so recent context stands out without overlapping candles.
- Kept the active spike badge, cooldown badge, and rail tags as one clean block.
- Event labels remain offset away from candles for cleaner screenshots.
------------------------
Interface & Usability
------------------------
- Cleaner right-side layout that no longer stacks multiple cooldown zones.
- The panel remains the full readout for spike state, cooldown score, volatility load, range, stability, readiness, and action.
- Default visual settings remain tuned for clean public-release screenshots, and can be raised for more history.
- Overall user experience improved without changing core logic.
------------------------
Behavior Notes
------------------------
This update does not change the core analytical logic of the script.
The goal is to reduce on-chart density, not to introduce new predictive behavior.
Users should interpret outputs the same way as before, now with a cleaner and lighter on-chart readout.
------------------------
Limitations Reminder
------------------------
The script remains a rule-based analytical tool.
Market conditions such as volatility, liquidity, and timeframe differences may affect how cooldown states appear.
Outputs should always be interpreted within broader market context.
------------------------
Risk Reminder
------------------------
This script is for educational and analytical purposes only.
It does not provide financial advice or guaranteed trading outcomes.
Users remain responsible for their own decisions.
Sürüm Notları
🔧 UPDATE NOTES - v2.1This update focuses on decision confidence and proof.
The core purpose of the script remains unchanged.
This release adds a confirmation-anchored proof layer that measures how stable the
calm and noisy volatility regimes identified by this planner have been on the symbol.
This script continues to function as an analytical and visualization tool.
It does not attempt to predict price direction or provide guaranteed outcomes.
------------------------
What Changed
------------------------
• Added a Proof Layer (Follow / Hold / React / Flip)
The panel now reports how stable the planner's calm-versus-noisy volatility regime has been
on the current symbol and timeframe. Rolling evaluation windows record the current
volatility regime (calm or noisy) and track how long it persists before it flips:
- React Rate : share of windows whose regime survived the short reaction window unchanged
- Follow Rate : share whose regime survived about half the horizon unchanged
- Hold Rate : share whose regime persisted through the full horizon
- Flip Rate : share whose regime changed within the horizon
A sample size (n) is shown so the rates are read in context, and they display as
"building" only during the brief warmup before the first window resolves. Because every
bar belongs to a regime window, the proof keeps accumulating on any chart.
• Added rate outputs to the data window
The Follow / Hold / React / Flip rates join the existing cooldown score, ATR load, range
ATR, and close-stability outputs in the data window so they can be referenced by alerts,
screeners, or other tools without changing the chart visuals.
------------------------
Visual Improvements
------------------------
• Grouped the proof metrics into a clean block under a dedicated "Proof @ Confirm" heading,
below the existing cooldown rows.
• Preserved the existing spike box, cooldown band, centered cooldown badge, spike rails,
rail tags, readability trail, and event labels.
• Refined panel structure so spike state, cooldown score, volatility load, readiness,
action, and proof context form a single, scannable card.
• Kept the cooldown badge centered in its band and all event labels offset away from
candles for clean readability.
------------------------
Interface & Usability
------------------------
• Optimized panel layout for clearer information flow with the new proof block.
• Improved at-a-glance interpretation by reporting how stable the identified volatility
regimes have been.
• Adjusted default visual settings for a more balanced appearance.
• Added a Proof input group (show/hide, proof horizon bars, reaction window bars) so the
proof layer is fully configurable without affecting the core cooldown logic.
------------------------
Behavior Notes
------------------------
This update does not change the core analytical logic of the script.
The proof rates are descriptive statistics of rolling volatility-regime windows on the
current symbol and timeframe. They measure how long a calm or noisy classification
persisted, not trade performance, and they do not change how the cooldown score or
readiness state is classified.
Users should interpret outputs the same way as before, now with added stability context.
------------------------
Limitations Reminder
------------------------
The script remains a rule-based analytical tool.
Proof rates depend on the amount of available history and on the current symbol and
timeframe; a small sample (low n) should be treated with caution. Each rolling window is
counted once, with the regime recorded at the start of the window. Market conditions such
as volatility, liquidity, and timeframe differences may affect how regimes and rates
appear.
Outputs should always be interpreted within broader market context.
------------------------
Risk Reminder
------------------------
This script is for educational and analytical purposes only.
It does not provide financial advice or guaranteed trading outcomes.
Users remain responsible for their own decisions.
Sürüm Notları
Version 2.2 — Confirmation, Proof Integrity and Lifecycle HardeningThis update strengthens confirmed readiness events, volatility-regime proof sampling, cooldown input safety, active-zone lifecycle handling, initialization reliability, visual spacing, and runtime efficiency while preserving the indicator’s core volatility cooldown model, panel structure, input names, alert titles, and AGPro publication styling.
• Rebuilt the confirmation-anchored Proof layer around distinct confirmed volatility-regime calls.
• Proof calculations now remain confirmed-close anchored even when the main chart workflow uses Realtime confirmation mode.
• Removed repeated re-sampling of the same unchanged calm or noisy regime after every completed Proof Horizon.
• The first valid post-warmup regime is seeded once, while subsequent Proof evaluations begin only when the confirmed binary volatility regime changes.
• Prevented long-lasting unchanged regimes from artificially inflating the Proof sample size.
• React records a regime that survives the effective early-confirmation window.
• Follow records a regime that remains intact through the intermediate Proof checkpoint.
• Hold records a regime that survives the complete Proof Horizon without changing.
• Flip records a confirmed calm-to-noisy or noisy-to-calm regime replacement before the horizon completes.
• Constrained the effective Reaction Window so it cannot extend beyond the active Proof Horizon.
• Constrained the intermediate Follow checkpoint so it always remains inside the Proof Horizon.
• Extended the selected Confirmation Mode to readiness, readable, noisy-reload, and sparse-context events.
• Confirmed Close mode now prevents unconfirmed readiness labels and alerts from becoming permanently registered during an unfinished bar.
• Added internal protection so Minimum Cooldown Bars cannot exceed the active Cooldown Review Window.
• Added internal ordering protection between Cooldown Target ATR Load and ATR Spike Load.
• The effective cooldown target now remains below the effective spike threshold, preserving valid cooldown-score normalization.
• Added a capped Chart Readable threshold so strict custom settings cannot create an unreachable score above 100.
• Added initialization protection to the ATR baseline, range-contraction average, and close-stability measurements.
• Added an engine warm-up period so spike registration does not begin before the required ATR and stability baselines are available.
• Improved active-zone lifecycle management by resetting current box, line, badge, and rail references whenever a new spike context begins.
• Prevented retained historical spike objects from being reused or modified as the active object set for a later spike.
• Cleared active object references safely when the cooldown context expires while preserving retained historical structures.
• Staggered High Rail and Low Rail tag positions horizontally to reduce overlap and improve publication screenshot readability.
• Added Data Window outputs for Volatility Regime State, Bars Since Spike, and Contraction Ratio.
• Reduced drawing-object limits to better match the script’s actual maximum zone, rail, and label requirements.
• Preserved all existing spike qualification inputs, cooldown-score components, readiness states, spike and cooldown zones, readability trail, event labels, panel rows, alerts, and AGPro visual identity.
Existing TradingView alerts should be deleted and recreated after installing Version 2.2 so they use the updated script logic and settings.

Crypto Setup Planner: agprolabs.com/product/crypto-setup-planner/
Dynamic Channels Elite: agprolabs.com/product/dynamic-channels-elite/
Trading Suite: agprolabs.com/product/trading-suite-agpro-series/
Dynamic Channels Elite: agprolabs.com/product/dynamic-channels-elite/
Trading Suite: agprolabs.com/product/trading-suite-agpro-series/
Feragatname
Bilgiler ve yayınlar, TradingView tarafından sağlanan veya onaylanan finansal, yatırım, alım satım veya diğer türden tavsiye veya öneriler anlamına gelmez ve teşkil etmez. Kullanım Koşulları bölümünde daha fazlasını okuyun.
Crypto Setup Planner: agprolabs.com/product/crypto-setup-planner/
Dynamic Channels Elite: agprolabs.com/product/dynamic-channels-elite/
Trading Suite: agprolabs.com/product/trading-suite-agpro-series/
Dynamic Channels Elite: agprolabs.com/product/dynamic-channels-elite/
Trading Suite: agprolabs.com/product/trading-suite-agpro-series/
Feragatname
Bilgiler ve yayınlar, TradingView tarafından sağlanan veya onaylanan finansal, yatırım, alım satım veya diğer türden tavsiye veya öneriler anlamına gelmez ve teşkil etmez. Kullanım Koşulları bölümünde daha fazlasını okuyun.