OPEN-SOURCE SCRIPT
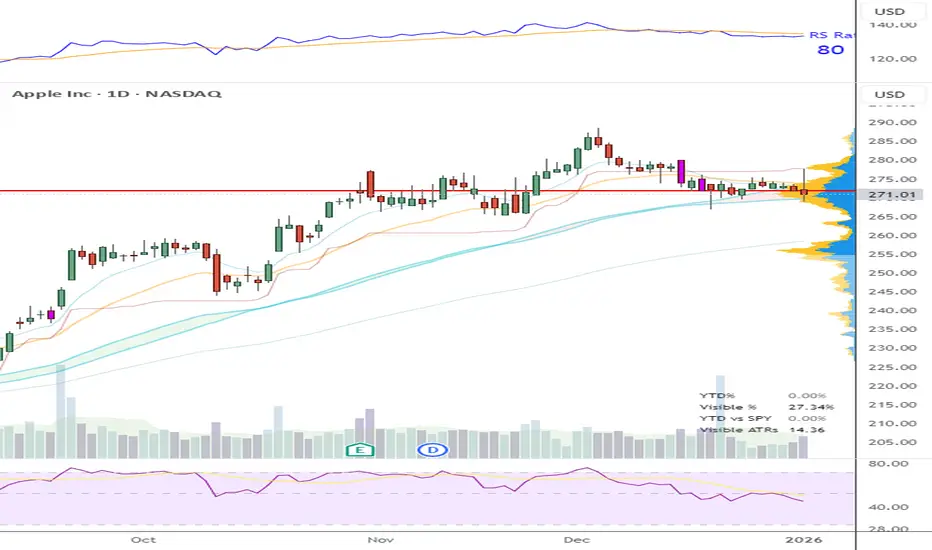
YTD % / Visible Range % Table
AUTHOR: Brandon Gum
DATE: 2026-01-03
// PURPOSE:
// Calculates price-range metrics based on the *currently visible*
// portion of the chart. Intended for table-based UI display where
// values must be stable and evaluated only on the last bar.
//
// Originally based on Jeff Sun's ADR price data table.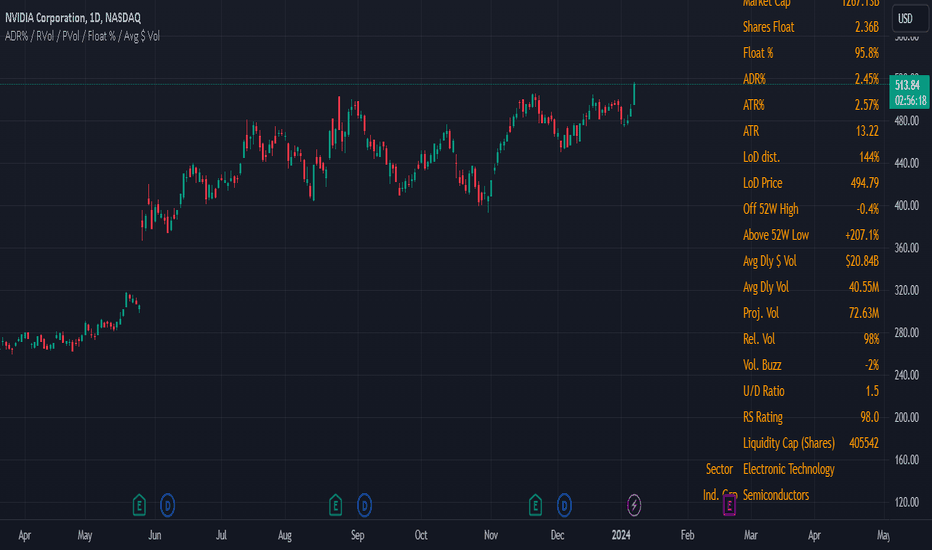
//
// METRICS RETURNED:
// - Visible High
// - Visible Low
// - Visible % Range = (Visible High - Visible Low) / Visible Low
// - Visible ATRs = (Visible High - Visible Low) / ATR
//
// IMPLEMENTATION NOTES:
// - Logic executes ONLY on barstate.islast to avoid state corruption.
// - Visible range is recomputed atomically using a backward loop
// bounded by chart.left_visible_bar_time.
// - Avoids var-based accumulation and bar-by-bar resets, which are
// unreliable when visible window changes.
// - ATR is evaluated at the current bar (not averaged over range).
//
// ASSUMPTIONS / LIMITATIONS:
// - Uses chart-visible time boundaries supplied by TradingView.
// - Loop upper bound must be sufficiently large to cover max
// expected visible bars.
// - Intended for display purposes, not signal generation.
//
// SIDE EFFECTS:
// - None. No plots, no drawings, no state persistence.
DATE: 2026-01-03
// PURPOSE:
// Calculates price-range metrics based on the *currently visible*
// portion of the chart. Intended for table-based UI display where
// values must be stable and evaluated only on the last bar.
//
// Originally based on Jeff Sun's ADR price data table.
//
// METRICS RETURNED:
// - Visible High
// - Visible Low
// - Visible % Range = (Visible High - Visible Low) / Visible Low
// - Visible ATRs = (Visible High - Visible Low) / ATR
//
// IMPLEMENTATION NOTES:
// - Logic executes ONLY on barstate.islast to avoid state corruption.
// - Visible range is recomputed atomically using a backward loop
// bounded by chart.left_visible_bar_time.
// - Avoids var-based accumulation and bar-by-bar resets, which are
// unreliable when visible window changes.
// - ATR is evaluated at the current bar (not averaged over range).
//
// ASSUMPTIONS / LIMITATIONS:
// - Uses chart-visible time boundaries supplied by TradingView.
// - Loop upper bound must be sufficiently large to cover max
// expected visible bars.
// - Intended for display purposes, not signal generation.
//
// SIDE EFFECTS:
// - None. No plots, no drawings, no state persistence.
Açık kaynak kodlu komut dosyası
Gerçek TradingView ruhuyla, bu komut dosyasının mimarı, yatırımcıların işlevselliğini inceleyip doğrulayabilmesi için onu açık kaynaklı hale getirdi. Yazarı tebrik ederiz! Ücretsiz olarak kullanabilseniz de, kodu yeniden yayınlamanın Topluluk Kurallarımıza tabi olduğunu unutmayın.

-If you find this idea interesting please leave a like
-Follow for more
-Comments are always welcomed and appreciated
-Follow for more
-Comments are always welcomed and appreciated
Feragatname
Bilgiler ve yayınlar, TradingView tarafından sağlanan veya onaylanan finansal, yatırım, alım satım veya diğer türden tavsiye veya öneriler anlamına gelmez ve teşkil etmez. Kullanım Koşulları bölümünde daha fazlasını okuyun.
Açık kaynak kodlu komut dosyası
Gerçek TradingView ruhuyla, bu komut dosyasının mimarı, yatırımcıların işlevselliğini inceleyip doğrulayabilmesi için onu açık kaynaklı hale getirdi. Yazarı tebrik ederiz! Ücretsiz olarak kullanabilseniz de, kodu yeniden yayınlamanın Topluluk Kurallarımıza tabi olduğunu unutmayın.
-If you find this idea interesting please leave a like
-Follow for more
-Comments are always welcomed and appreciated
-Follow for more
-Comments are always welcomed and appreciated
Feragatname
Bilgiler ve yayınlar, TradingView tarafından sağlanan veya onaylanan finansal, yatırım, alım satım veya diğer türden tavsiye veya öneriler anlamına gelmez ve teşkil etmez. Kullanım Koşulları bölümünde daha fazlasını okuyun.