OPEN-SOURCE SCRIPT
Güncellendi Bishop Chicken Biryani Ribbon
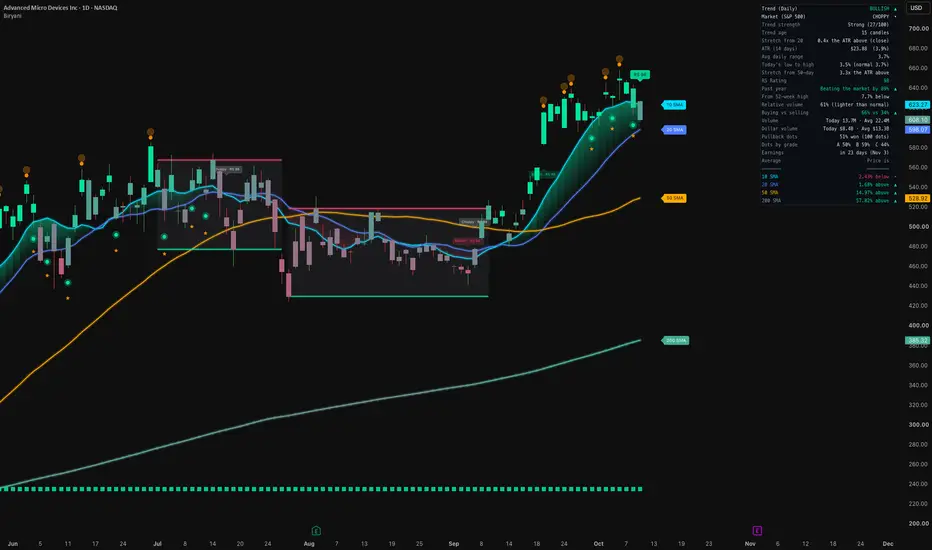
Chicken Biryani is great and the greatest dish out there, if you havent had it you should defitinitley try it out at your local indian resturaunt
Sürüm Notları
This allows you to use 4 SMA's to create two separate ribbons, you can customize a lot of things here so make sure to checkout all the settingsAlso, Chicken Biryani is the greatest food out there, nothing compares to it
Sürüm Notları
Just fixing the nameSürüm Notları
This is a one stop indicator that I made for all traders that allows you to use SMAs, EMAs and WMA Additional to this there are Multi-Timeframe (MTF) SMAs that allows you to be in one timeframe but be able to see timeframes from another timeframe and SMA ribbons which compare the crossover, sentiment and distance between whichever two SMAs you chose. There are also crossovers but I find that useless to be honest
Sürüm Notları
Made a few bug fixes to MTF SMAs and added up to 7 MTF SMAsSürüm Notları
Fixed labels bug where it keeps populatingSürüm Notları
Biryani V42: a full rebuildThis update replaces V14 with a completely rebuilt indicator. The notes above are for the old version, so this note walks you guys through what it does now.
Heads up, your old settings will not carry over. After you update, remove Biryani from your chart and add it again from the Indicators menu so you start fresh on the new defaults.
The core is the same thing a lot of you already use: a clean moving-average ribbon (SMA 10 / 20 / 50 / 200 by default) so you can see the trend at a glance. Almost everything else is optional and stays off until you turn it on, so your chart stays simple unless you want more on it.
Settings are now split into 18 numbered sections written in plain English. If you are not sure what something does, hover the (i) next to it.
Quick Setup
- Presets: Custom (your own settings), Bishop Bullish Swing + RS (my own swing setup), Swing, Day trade, Scalp and Minimal.
- While a preset is chosen, the settings it controls are locked. If you want to change them, pick Custom.
The Ribbon
- Up to 7 averages, each one can be SMA, EMA, WMA, HMA, ALMA, T3 or VWMA.
- Any average can be colored by direction: green while it is rising, pink while it is falling, gray when it is flat.
- Colors match your chart automatically, Bishop Neon on dark charts and Bishop Light on white charts. Classic and Custom themes are in there too.
- A trend cloud between two averages that fades as the lines come together.
- Candles colored by how far price is from Average 2.
Reading the Trend
- Every candle gets a reading: Bullish (averages stacked up with price above them), Bearish (the mirror image of that), Choppy (a weak trend that is not building) or Mixed.
- Choppy stretches can dim or gray out the cloud and candles.
- Optional: tags when the trend changes, triangles when the cloud flips, purple shading when the lines bunch up (a squeeze) and a background tint.
Pullback Dots (optional)
- You get a dot when price dips to one average but closes beyond another, in the direction of the trend.
- Optional filters: first pullback of each trend only, lighter-volume dips only, and an A / B / C quality grade.
- The dashboard has a scoreboard showing how past dots on that chart played out, overall and by grade. Keep in mind that is past results on that chart, it does not promise anything going forward.
RS Rating (1 to 99)
- This is an IBD-style Relative Strength Rating. It compares the stock's past year with about 6,100 US stocks, so a 99 means it has been stronger than 99% of them. The last 3 months count double.
- Works on any chart timeframe.
- Optional chart extras: orange dots when the RS line hits a new high, an "RS 92" badge on the last candle, stars on pullback dots from leaders (RS 80 and up), a green / gray / red strip along the bottom, and the rating on the trend change tags.
- If the daily rating data is running late, the rating shows with a * next to it so you know it is an estimate.
More Chart Tools (optional)
- Range channel: a support and resistance box drawn while the market is choppy.
- Previous day high, low and close (intraday charts).
- Auto fib extensions (Beta): trend-based fib extensions drawn the way you would draw them by hand. These are still being tested, so I personally would check them against your own drawing for now.
- Bigger-timeframe lines, for example the daily 100 average on a 15 minute chart.
- Name tags at the end of each line.
Dashboard
- Full or Compact. Compact uses shorter wording and is made for phones. You pick which rows show.
- What it can show: trend on other timeframes and whether they agree, the market (S&P 500), trend strength (for example "Strong (25/100)"), trend age, stretch from Average 2, RS Rating, past year vs the market, earnings countdown, sector and industry, and a list of your averages with where price sits.
- Swing Stats, each one off until you tick it: ATR (in $ and %), average daily range, today's range vs a normal day, stretch from the 50-day, distance from the 52-week high, relative volume, buying vs selling volume, and volume and dollar volume today vs average.
Alerts and Screener
- Tick the events you want (trend changes, cloud flips, pullback dots, squeezes), then create one alert with "Any alert() function call" and you get all of them from that one alert.
- Four values for the Pine Screener: trend, pullback dot, trend strength and RS Rating.
No Repainting
- By default, dots, triangles, tags and stars only show up after the candle closes.
- Bigger-timeframe lines and grades only use finished candles. On intraday charts the RS features use the previous day's finished rating. Nothing changes after a reload.
Credits
The RS Rating uses Fred6724's free daily rating data, and the rating curve is adapted from his RS Rating script (Mozilla Public License 2.0). Thank you Fred, really appreciate it.
Why we use Fred's data and not our own: a real 1 to 99 rating means ranking every US stock against each other, every single day. An indicator cannot scan 6,100 stocks on its own, so that ranking has to come in from an outside daily data feed (TradingView calls these Pine Seeds). TradingView no longer lets anyone start a new one, so we cannot run our own. Fred's feed already does this and it is free, so it made sense to use it.
If you run into anything or have questions, let me know in the comments. Hopefully it helps
And yes, Chicken Biryani is still the greatest food out there.
Sürüm Notları
Update: Simple preset + moving average color fixNew preset: Simple (SMA 10 / 20 / 50 / 200, lines only)
- Just the 10, 20, 50 and 200 moving averages with their glow, name tags and prices. No cloud, no candle colors, no signals, no dashboard.
- Pick it in Quick Setup (section 1) if you want your chart super clean.
Fixed: changing the moving average colors
- Some of you noticed that changing the line colors didn't do anything. That's fixed. Change a line's color in the Inputs tab (section 2) and it now shows up on every color theme, not just Custom.
- If "by direction" is ticked on a line (the 200 has it on by default), the green / pink direction colors still win, so untick it to use your own color.
- The moving averages were taken out of the Style tab, since colors changed there could never change the lines.
Your current settings carry over, so there's nothing to redo.
And yes, Chicken Biryani is still the greatest food out there.
Sürüm Notları
Small fixes- The trend clouds stay on again even if you turn off their lines. For example, hide the 10 and 20 and Cloud 1 still shows. A cloud now only goes away when you untick it.
- Name tags now sit right at the end of their own line, one candle after the last candle. Before, they could float far away from their lines when the lines were close together.
- If you want tags pushed apart when two lines overlap, there's a new Name Tags setting: "Push overlapping tags apart" (0 = off).
- Dashboard: the Stretch row now says "very stretched" whenever it shows the amber !.
Fun fact: real biryani is cooked in layers, rice over meat, stacked in the right order. Same as a bullish ribbon. If the layers are out of order, something's off.
Sürüm Notları
Back to the original V14This script is going back to the original V14, so anyone who liked the old version can keep using it here.
The full rebuild (RS Rating, dashboard, pullback dots, presets and everything from the last few updates) now has its own home: Bishop Biryani Ribbons V2
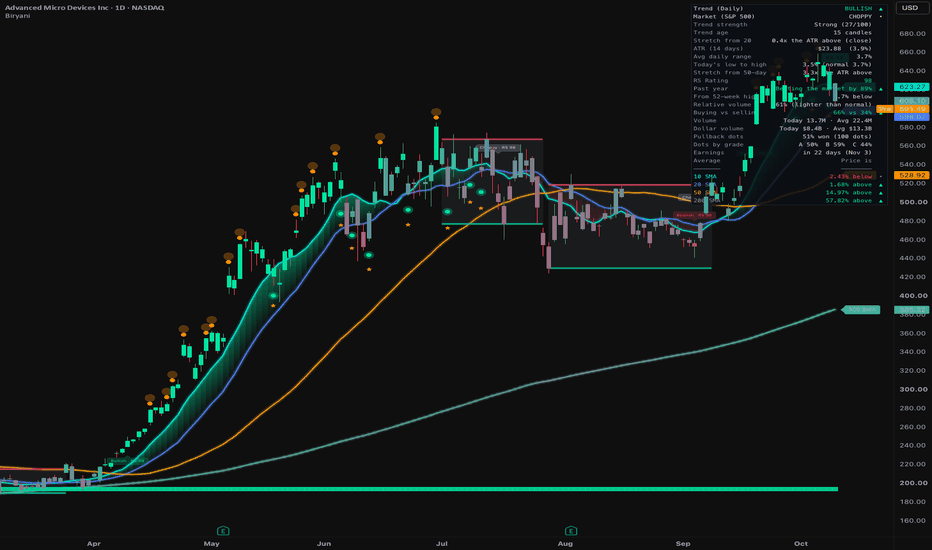
If you want the new version, add it from the Indicators menu.
Fun fact: the word biryani comes from the Persian "birian", which means fried or roasted before cooking.
Açık kaynak kodlu komut dosyası
Gerçek TradingView ruhuyla, bu komut dosyasının mimarı, yatırımcıların işlevselliğini inceleyip doğrulayabilmesi için onu açık kaynaklı hale getirdi. Yazarı tebrik ederiz! Ücretsiz olarak kullanabilseniz de, kodu yeniden yayınlamanın Topluluk Kurallarımıza tabi olduğunu unutmayın.

Feragatname
Bilgiler ve yayınlar, TradingView tarafından sağlanan veya onaylanan finansal, yatırım, alım satım veya diğer türden tavsiye veya öneriler anlamına gelmez ve teşkil etmez. Kullanım Koşulları bölümünde daha fazlasını okuyun.
Açık kaynak kodlu komut dosyası
Gerçek TradingView ruhuyla, bu komut dosyasının mimarı, yatırımcıların işlevselliğini inceleyip doğrulayabilmesi için onu açık kaynaklı hale getirdi. Yazarı tebrik ederiz! Ücretsiz olarak kullanabilseniz de, kodu yeniden yayınlamanın Topluluk Kurallarımıza tabi olduğunu unutmayın.
Feragatname
Bilgiler ve yayınlar, TradingView tarafından sağlanan veya onaylanan finansal, yatırım, alım satım veya diğer türden tavsiye veya öneriler anlamına gelmez ve teşkil etmez. Kullanım Koşulları bölümünde daha fazlasını okuyun.