OPEN-SOURCE SCRIPT
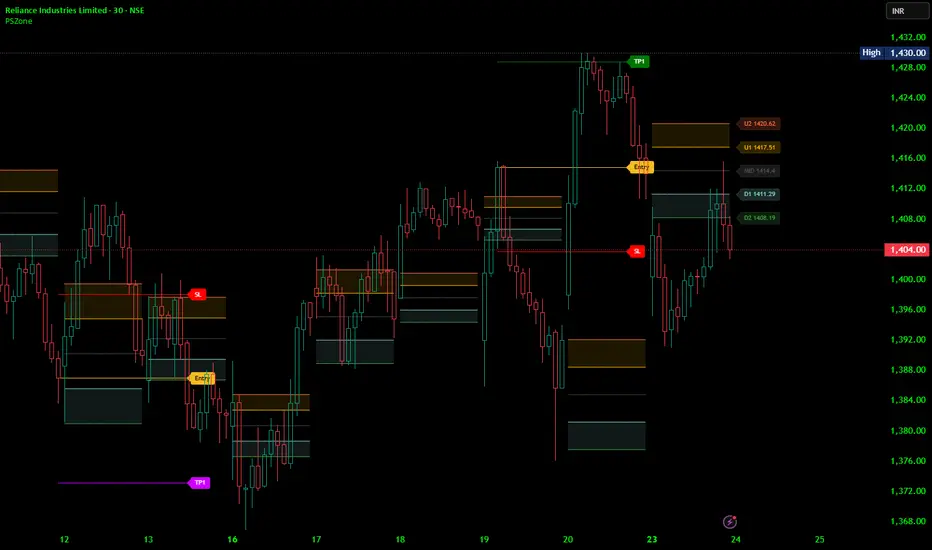
Price Structure Zones with Trend Filter Signals
What the script is
This is a two-engine trading system combining two independent but complementary methodologies:
Engine 1 — Camarilla Pivot Zones (the "map")
Camarilla pivots are price levels derived from the previous period's High, Low, and Close. They act like a gravitational grid — price tends to bounce between these levels intraday. There are 5 resistance levels (U1–U5) above the previous close and 5 support levels (D1–D5) below it. The formulas are fixed constants from Franklin Ochoa's Secrets of a Pivot Boss.
Engine 2 — Momentum/ADX Filter + Range Filter (the "trigger")
The ADX (Average Directional Index) measures trend strength, not direction. When ADX is below your threshold, the market is consolidating/ranging. The script then applies a Range Filter — a smoothed band around price — to detect the precise moment price breaks out of that consolidation. That breakout becomes your entry signal, complete with SL and TP levels.
How to read each level:
U1 / D1 & U2 / D2 — Minor friction zones. Price often pauses or wicks here but doesn't reverse hard. Not great for entries; good for partial profit-taking.
U3 / D3 — The "decision zone." Price respecting U3 (failing to break above) is a short signal; price holding D3 (bouncing off support) is a long signal. These are your primary reversal trade zones.
U4 / D4 — The breakout threshold. A clean daily close above U4 = strong bullish momentum. Below D4 = strong bearish momentum. These are your breakout continuation entries.
U5 / D5 — Extreme exhaustion / spike targets. Rarely reached but useful as hard TP or warning zones when reached intraday.
How to trade the signals-
Two distinct trade setups exist:
Setup A — Reversal trade at U3/D3
When price approaches U3 from below and the ADX signal fires short (range filter steps down), that is a high-probability short. Entry at the close of the signal bar, SL above U4, TP1 at U1/MID, TP2 at D1. The reverse logic applies at D3 for longs. This is the bread-and-butter setup — it works best in ranging/sideways markets.
Setup B — Breakout trade above U4 / below D4
When price breaks and closes above U4 with the ADX signal firing long, that is a momentum continuation trade. This one requires the ADX to have been low (consolidating) before the breakout — the script's cooldown and range detection ensure you're catching the first pop out of compression, not a late chase.
How SL and TP are calculated by the script:
The risk levels are multiples of the Band Radius (a smoothed ATR-like measure). By default: SL = 0.4× band radius, TP1 = 0.5× band radius, TP2 = 1.0× band radius. This gives you roughly a 1.25:1 reward-to-risk on TP1 — conservative and achievable. TP2 is disabled by default; enable it for trending markets.
Best timeframes:
The pivot resolution (currently set to Daily "D") is independent of your chart timeframe. Here's how to think about it:
Pivot resolution "D" (Daily pivots) works best on:
5-minute to 30-minute charts for intraday scalping and day trading
1-hour charts for intraday swing entries
These are the most commonly used Camarilla applications
Pivot resolution "W" (Weekly pivots) works best on:
1-hour to 4-hour charts
Good for swing traders holding 2–5 days
Pivot resolution "M" (Monthly pivots) works best on:
Daily charts
Good for position traders holding weeks to months
Practical tips:
Confluence is everything. The best trades happen when the ADX signal fires exactly at a U3 or D3 level. An ADX signal in the middle of nowhere between levels is lower quality — skip it or reduce size.
Avoid trading through major news. The script has no awareness of fundamental events. If a signal fires 10 minutes before a Budget/central bank/RBI announcement, stand aside.
The cooldown bar setting (default 20) prevents re-entry too soon after a signal. On faster timeframes (5m), you may want to reduce it to 8–12. On 4H/Daily, increase it to 30–50.
On Indian markets specifically (NSE/BSE): Daily pivots on a 15-minute chart work very well for Nifty 50, Bank Nifty, and individual large-cap stocks. The 9:15–10:00 opening range often sets the tone, and U3/D3 levels tend to act as strong intraday magnets. Watch for the first ADX signal after 10:00 AM IST when the opening volatility has settled.
Past statistical behavior does not guarantee future results — use as context, not as a signal in isolation. Enjoy !!
This is a two-engine trading system combining two independent but complementary methodologies:
Engine 1 — Camarilla Pivot Zones (the "map")
Camarilla pivots are price levels derived from the previous period's High, Low, and Close. They act like a gravitational grid — price tends to bounce between these levels intraday. There are 5 resistance levels (U1–U5) above the previous close and 5 support levels (D1–D5) below it. The formulas are fixed constants from Franklin Ochoa's Secrets of a Pivot Boss.
Engine 2 — Momentum/ADX Filter + Range Filter (the "trigger")
The ADX (Average Directional Index) measures trend strength, not direction. When ADX is below your threshold, the market is consolidating/ranging. The script then applies a Range Filter — a smoothed band around price — to detect the precise moment price breaks out of that consolidation. That breakout becomes your entry signal, complete with SL and TP levels.
How to read each level:
U1 / D1 & U2 / D2 — Minor friction zones. Price often pauses or wicks here but doesn't reverse hard. Not great for entries; good for partial profit-taking.
U3 / D3 — The "decision zone." Price respecting U3 (failing to break above) is a short signal; price holding D3 (bouncing off support) is a long signal. These are your primary reversal trade zones.
U4 / D4 — The breakout threshold. A clean daily close above U4 = strong bullish momentum. Below D4 = strong bearish momentum. These are your breakout continuation entries.
U5 / D5 — Extreme exhaustion / spike targets. Rarely reached but useful as hard TP or warning zones when reached intraday.
How to trade the signals-
Two distinct trade setups exist:
Setup A — Reversal trade at U3/D3
When price approaches U3 from below and the ADX signal fires short (range filter steps down), that is a high-probability short. Entry at the close of the signal bar, SL above U4, TP1 at U1/MID, TP2 at D1. The reverse logic applies at D3 for longs. This is the bread-and-butter setup — it works best in ranging/sideways markets.
Setup B — Breakout trade above U4 / below D4
When price breaks and closes above U4 with the ADX signal firing long, that is a momentum continuation trade. This one requires the ADX to have been low (consolidating) before the breakout — the script's cooldown and range detection ensure you're catching the first pop out of compression, not a late chase.
How SL and TP are calculated by the script:
The risk levels are multiples of the Band Radius (a smoothed ATR-like measure). By default: SL = 0.4× band radius, TP1 = 0.5× band radius, TP2 = 1.0× band radius. This gives you roughly a 1.25:1 reward-to-risk on TP1 — conservative and achievable. TP2 is disabled by default; enable it for trending markets.
Best timeframes:
The pivot resolution (currently set to Daily "D") is independent of your chart timeframe. Here's how to think about it:
Pivot resolution "D" (Daily pivots) works best on:
5-minute to 30-minute charts for intraday scalping and day trading
1-hour charts for intraday swing entries
These are the most commonly used Camarilla applications
Pivot resolution "W" (Weekly pivots) works best on:
1-hour to 4-hour charts
Good for swing traders holding 2–5 days
Pivot resolution "M" (Monthly pivots) works best on:
Daily charts
Good for position traders holding weeks to months
Practical tips:
Confluence is everything. The best trades happen when the ADX signal fires exactly at a U3 or D3 level. An ADX signal in the middle of nowhere between levels is lower quality — skip it or reduce size.
Avoid trading through major news. The script has no awareness of fundamental events. If a signal fires 10 minutes before a Budget/central bank/RBI announcement, stand aside.
The cooldown bar setting (default 20) prevents re-entry too soon after a signal. On faster timeframes (5m), you may want to reduce it to 8–12. On 4H/Daily, increase it to 30–50.
On Indian markets specifically (NSE/BSE): Daily pivots on a 15-minute chart work very well for Nifty 50, Bank Nifty, and individual large-cap stocks. The 9:15–10:00 opening range often sets the tone, and U3/D3 levels tend to act as strong intraday magnets. Watch for the first ADX signal after 10:00 AM IST when the opening volatility has settled.
Past statistical behavior does not guarantee future results — use as context, not as a signal in isolation. Enjoy !!
Açık kaynak kodlu komut dosyası
Gerçek TradingView ruhuyla, bu komut dosyasının mimarı, yatırımcıların işlevselliğini inceleyip doğrulayabilmesi için onu açık kaynaklı hale getirdi. Yazarı tebrik ederiz! Ücretsiz olarak kullanabilseniz de, kodu yeniden yayınlamanın Topluluk Kurallarımıza tabi olduğunu unutmayın.

Feragatname
Bilgiler ve yayınlar, TradingView tarafından sağlanan veya onaylanan finansal, yatırım, alım satım veya diğer türden tavsiye veya öneriler anlamına gelmez ve teşkil etmez. Kullanım Koşulları bölümünde daha fazlasını okuyun.
Açık kaynak kodlu komut dosyası
Gerçek TradingView ruhuyla, bu komut dosyasının mimarı, yatırımcıların işlevselliğini inceleyip doğrulayabilmesi için onu açık kaynaklı hale getirdi. Yazarı tebrik ederiz! Ücretsiz olarak kullanabilseniz de, kodu yeniden yayınlamanın Topluluk Kurallarımıza tabi olduğunu unutmayın.
Feragatname
Bilgiler ve yayınlar, TradingView tarafından sağlanan veya onaylanan finansal, yatırım, alım satım veya diğer türden tavsiye veya öneriler anlamına gelmez ve teşkil etmez. Kullanım Koşulları bölümünde daha fazlasını okuyun.