OPEN-SOURCE SCRIPT
Güncellendi Earnings and Sales Acceleration [skm]
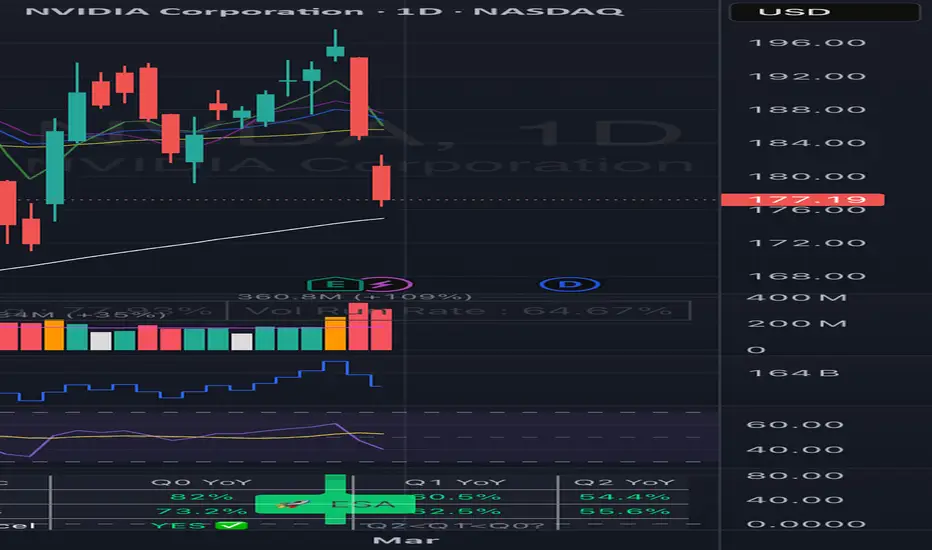
Earnings & Sales Acceleration (ESA)
Identifies stocks where both EPS and revenue growth are accelerating over three consecutive quarters on a year-over-year basis -- the "second derivative" of earnings growth popularised by investors like Stanley Druckenmiller. The idea is that a company posting an increasing YoY growth rate each quarter is building fundamental momentum the market often underestimates.
HOW ACCELERATION IS DEFINED
EPS Acceleration: YoY EPS growth must be strictly increasing across three consecutive quarters -- Q2 < Q1 < Q0 (oldest to newest). Each quarter is compared to the same quarter one year prior (4 earnings events back).
Revenue Acceleration: Same logic applied to YoY revenue growth. For newly listed stocks with limited history, TradingView's pre-calculated REVENUE_ONE_YEAR_GROWTH field is used as a fallback.
Strong Signal: Triggered only when both EPS and Revenue are simultaneously accelerating. This dual confirmation reduces false positives.
WHAT IS PLOTTED
- EPS YoY% columns at each earnings bar. Green = EPS accelerating, Red = not.
- Sales YoY% columns at each earnings bar. Green = Sales accelerating, Red = not.
- ESA label above the bar on a Strong Acceleration signal.
- DEC label below the bar on a Strong Deceleration signal.
- All visuals appear only at earnings event bars, keeping the chart clean.
A summary table in the top-right shows Q0, Q1, Q2 YoY growth for both EPS and Sales, plus YES/NO acceleration status and the overall signal.
HOW TO USE IN PINE SCREENER
The indicator exposes three screener outputs:
"Accel Signal = 1" -- Both EPS and Revenue accelerating for 3 consecutive quarters (strictest filter).
"EPS Accel Signal = 1" -- EPS alone accelerating for 3 consecutive quarters.
"Rev Accel Signal = 1" -- Revenue alone accelerating for 3 consecutive quarters.
To use: open the Stock Screener, click Filters, scroll to Add Indicator, search for "Earnings & Sales Acceleration" and add it. Set your chosen condition to = 1.
For best results, combine with additional filters such as minimum market cap, average volume above 500K, and a trend condition (e.g. price above the 50-week EMA) to ensure chart structure supports the fundamental thesis.
ALERTS
Two alert conditions are included: Strong Dual Acceleration (both metrics accelerating) and Strong Dual Deceleration (both decelerating). Set these via right-click on the indicator name.
LIMITATIONS
- Requires TradingView fundamental data. Not available for ETFs, indices, forex or crypto.
- Stocks with fewer than 6 quarters of history will show N/A for EPS acceleration.
- When the prior year quarter had negative EPS, YoY percentages should be interpreted with caution.
- Best viewed on Weekly charts to align with the quarterly earnings cadence.
Identifies stocks where both EPS and revenue growth are accelerating over three consecutive quarters on a year-over-year basis -- the "second derivative" of earnings growth popularised by investors like Stanley Druckenmiller. The idea is that a company posting an increasing YoY growth rate each quarter is building fundamental momentum the market often underestimates.
HOW ACCELERATION IS DEFINED
EPS Acceleration: YoY EPS growth must be strictly increasing across three consecutive quarters -- Q2 < Q1 < Q0 (oldest to newest). Each quarter is compared to the same quarter one year prior (4 earnings events back).
Revenue Acceleration: Same logic applied to YoY revenue growth. For newly listed stocks with limited history, TradingView's pre-calculated REVENUE_ONE_YEAR_GROWTH field is used as a fallback.
Strong Signal: Triggered only when both EPS and Revenue are simultaneously accelerating. This dual confirmation reduces false positives.
WHAT IS PLOTTED
- EPS YoY% columns at each earnings bar. Green = EPS accelerating, Red = not.
- Sales YoY% columns at each earnings bar. Green = Sales accelerating, Red = not.
- ESA label above the bar on a Strong Acceleration signal.
- DEC label below the bar on a Strong Deceleration signal.
- All visuals appear only at earnings event bars, keeping the chart clean.
A summary table in the top-right shows Q0, Q1, Q2 YoY growth for both EPS and Sales, plus YES/NO acceleration status and the overall signal.
HOW TO USE IN PINE SCREENER
The indicator exposes three screener outputs:
"Accel Signal = 1" -- Both EPS and Revenue accelerating for 3 consecutive quarters (strictest filter).
"EPS Accel Signal = 1" -- EPS alone accelerating for 3 consecutive quarters.
"Rev Accel Signal = 1" -- Revenue alone accelerating for 3 consecutive quarters.
To use: open the Stock Screener, click Filters, scroll to Add Indicator, search for "Earnings & Sales Acceleration" and add it. Set your chosen condition to = 1.
For best results, combine with additional filters such as minimum market cap, average volume above 500K, and a trend condition (e.g. price above the 50-week EMA) to ensure chart structure supports the fundamental thesis.
ALERTS
Two alert conditions are included: Strong Dual Acceleration (both metrics accelerating) and Strong Dual Deceleration (both decelerating). Set these via right-click on the indicator name.
LIMITATIONS
- Requires TradingView fundamental data. Not available for ETFs, indices, forex or crypto.
- Stocks with fewer than 6 quarters of history will show N/A for EPS acceleration.
- When the prior year quarter had negative EPS, YoY percentages should be interpreted with caution.
- Best viewed on Weekly charts to align with the quarterly earnings cadence.
Sürüm Notları
Earnings & Sales Acceleration (ESA)Identifies stocks where both EPS and revenue growth are accelerating over three consecutive quarters on a year-over-year basis -- the "second derivative" of earnings growth popularised by investors like Stanley Druckenmiller. The idea is that a company posting an increasing YoY growth rate each quarter is building fundamental momentum the market often underestimates.
HOW ACCELERATION IS DEFINED
EPS Acceleration: YoY EPS growth must be strictly increasing across three consecutive quarters -- Q2 < Q1 < Q0 (oldest to newest). Each quarter is compared to the same quarter one year prior (4 earnings events back).
Revenue Acceleration: Same logic applied to YoY revenue growth. For newly listed stocks with limited history, TradingView's pre-calculated REVENUE_ONE_YEAR_GROWTH field is used as a fallback.
Strong Signal: Triggered only when both EPS and Revenue are simultaneously accelerating. This dual confirmation reduces false positives.
WHAT IS PLOTTED
- EPS YoY% columns at each earnings bar. Green = EPS accelerating, Red = not.
- Sales YoY% columns at each earnings bar. Green = Sales accelerating, Red = not.
- ESA label above the bar on a Strong Acceleration signal.
- DEC label below the bar on a Strong Deceleration signal.
- All visuals appear only at earnings event bars, keeping the chart clean.
A summary table in the top-right shows Q0, Q1, Q2 YoY growth for both EPS and Sales, plus YES/NO acceleration status and the overall signal.
HOW TO USE IN PINE SCREENER
The indicator exposes three screener outputs:
"Accel Signal = 1" -- Both EPS and Revenue accelerating for 3 consecutive quarters (strictest filter).
"EPS Accel Signal = 1" -- EPS alone accelerating for 3 consecutive quarters.
"Rev Accel Signal = 1" -- Revenue alone accelerating for 3 consecutive quarters.
To use: open the Stock Screener, click Filters, scroll to Add Indicator, search for "Earnings & Sales Acceleration" and add it. Set your chosen condition to = 1.
For best results, combine with additional filters such as minimum market cap, average volume above 500K, and a trend condition (e.g. price above the 50-week EMA) to ensure chart structure supports the fundamental thesis.
ALERTS
Two alert conditions are included: Strong Dual Acceleration (both metrics accelerating) and Strong Dual Deceleration (both decelerating). Set these via right-click on the indicator name.
LIMITATIONS
- Requires TradingView fundamental data. Not available for ETFs, indices, forex or crypto.
- Stocks with fewer than 6 quarters of history will show N/A for EPS acceleration.
- When the prior year quarter had negative EPS, YoY percentages should be interpreted with caution.
- Best viewed on Weekly charts to align with the quarterly earnings cadence.
Açık kaynak kodlu komut dosyası
Gerçek TradingView ruhuyla, bu komut dosyasının mimarı, yatırımcıların işlevselliğini inceleyip doğrulayabilmesi için onu açık kaynaklı hale getirdi. Yazarı tebrik ederiz! Ücretsiz olarak kullanabilseniz de, kodu yeniden yayınlamanın Topluluk Kurallarımıza tabi olduğunu unutmayın.

Feragatname
Bilgiler ve yayınlar, TradingView tarafından sağlanan veya onaylanan finansal, yatırım, alım satım veya diğer türden tavsiye veya öneriler anlamına gelmez ve teşkil etmez. Kullanım Koşulları bölümünde daha fazlasını okuyun.
Açık kaynak kodlu komut dosyası
Gerçek TradingView ruhuyla, bu komut dosyasının mimarı, yatırımcıların işlevselliğini inceleyip doğrulayabilmesi için onu açık kaynaklı hale getirdi. Yazarı tebrik ederiz! Ücretsiz olarak kullanabilseniz de, kodu yeniden yayınlamanın Topluluk Kurallarımıza tabi olduğunu unutmayın.
Feragatname
Bilgiler ve yayınlar, TradingView tarafından sağlanan veya onaylanan finansal, yatırım, alım satım veya diğer türden tavsiye veya öneriler anlamına gelmez ve teşkil etmez. Kullanım Koşulları bölümünde daha fazlasını okuyun.