Güncellendi
TradeBee RangeFlip [RF15]
RangeFlip [RF15] + ORB — Indicator Guide
1. What the indicator does
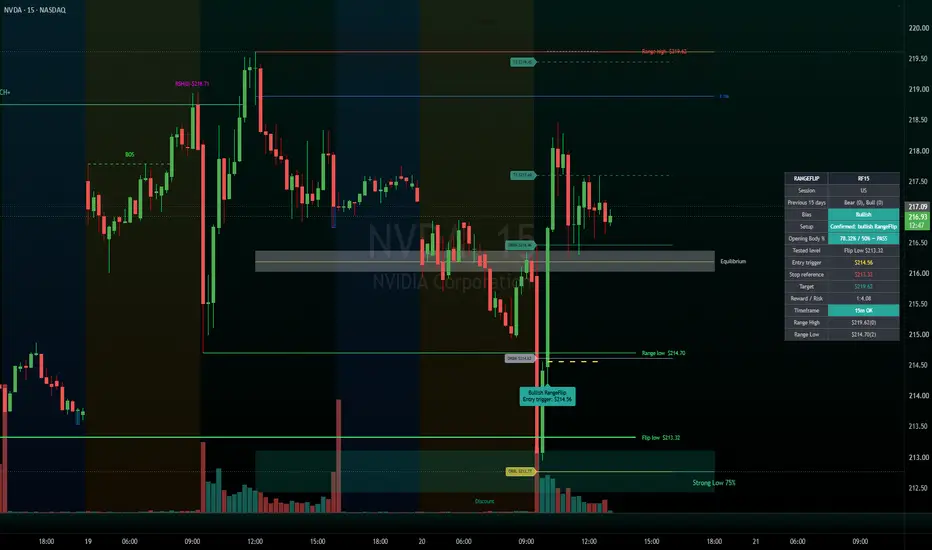
RangeFlip [RF15] is a 15-minute trading indicator designed to identify potential bullish and bearish reversal setups around historical price levels during a selected trading session. The added Opening Range Breakout (ORB) module plots the session's opening range and projected target levels. This is usually helpful for intraday trading on Large/Mega caps, ETF's.
It combines three useful elements:
• Historical levels: Range High, Range Low, Flip High and Flip Low act as potential resistance and support reference points.
• RangeFlip signals: Looks for an opening-candle break of a historical level followed by an opposite-direction candle that confirms the setup.
• ORB levels and targets: Shows the opening range, midpoint and projected price targets to help assess potential breakout areas.
The indicator is a decision-support tool, not a guarantee of a profitable trade.
2. How to use it
Step 1 — Identify the important levels
Start with the four historical levels. Observe where the selected session's price action approaches, tests or breaks one of these levels.
Step 2 — Wait for the RangeFlip setup
The opening candle must meet the minimum body-size requirement and breach a historical level. A second, opposite-direction candle must confirm the setup. The indicator then identifies a potential bullish or bearish bias.
Step 3 — Assess the entry, stop and target
Use the dashboard's entry trigger, stop reference, target and reward/risk information alongside the ORB levels. A bullish entry trigger is based on the second candle's high; a bearish trigger is based on its low.
Step 4 — Apply your trade plan
Confirm that the potential trade has adequate room to its target, determine your position size and risk limit, and avoid treating an indicator signal as an automatic instruction to trade.
Important: The indicator is intended for a 15-minute chart. The selected session controls the setup timing and the ORB opening range. Check the dashboard's timeframe status before relying on a signal.
3. Configuration panel explained
01. Historical Levels
Setting What it controls
Days searched for flip levels Number of previous regular trading sessions searched for historical levels. Default: 250.
Line extension (chart bars) How far the historical level lines extend beyond the latest candle. Default: 5 bars.
Show level labels Shows or hides each available level's name and price.
02. Level Appearance
Setting What it controls
Level line style Solid, dashed or dotted lines.
Range line width Thickness of Range High and Range Low lines.
Flip line width Thickness of Flip High and Flip Low lines.
03. RangeFlip Rules
Setting What it controls
Setup session Selects the US, Asia, Europe or India session.
Opening candle minimum body (%) Minimum candle-body size as a percentage of its full high-low range. Default: 50%. A higher setting requires a stronger-bodied candle.
Range breach detection Wick: a high/low touch or cross can qualify. Body: the candle must open on one side and close beyond the level.
Setup window after session open Restricts qualifying setups to the first 15, 30, 45 or 60 minutes. Default: 60 minutes.
Show entry, stop and target lines Displays the trade-reference lines on the chart.
Show signal labels Displays the bullish or bearish RangeFlip label.
Enable bullish alerts Enables bullish alert conditions.
Enable bearish alerts Enables bearish alert conditions.
Enable dynamic alert() messages Enables alert messages containing details such as session, symbol and entry trigger.
04. Dashboard
The dashboard summarizes the current setup and recent signal information.
Setting What it controls
Display dashboard? Shows or hides the entire panel.
Show table header? Shows or hides the RANGEFLIP / RF15 heading.
Panel Position Places the panel at a supported chart corner or Middle Right.
Label Text Size Tiny, Small, Normal or Large.
Background Color / Default Text Color Adjusts dashboard appearance.
Show session row Displays the selected session.
Show recent signal history Displays recent signal history.
Signal history lookback (calendar days) Controls the history period, from 1 to 365 days; default: 15.
Show trade bias Displays Bullish, Bearish or No Trade.
Show setup status Displays whether the setup qualifies.
Show tested level Displays the historical level that was breached.
Show entry price Displays the entry trigger price.
Show stop reference Displays the tested level used as the stop reference.
Show target Displays the qualifying opposite historical level, when applicable.
Show reward/risk Displays the theoretical reward-to-risk ratio.
Show timeframe status Indicates whether the chart is on the required 15-minute timeframe.
The dashboard fields can be toggled individually to keep it compact. The reward/risk value is theoretical; it does not establish that a trade would fill at the trigger or achieve its target.
ORB — Opening Range Breakout
These settings control the opening range, its appearance and its projected targets.
Setting What it controls
Show ORB Lines Turns the ORB display on or off.
ORB High Color / ORB Low Color Sets the colors of the opening-range high and low.
ORB Duration (Minutes) Sets the opening-range duration from the selected session's regular open. Default: 15 minutes.
ORB Line Style / ORB Line Width Controls the opening-range line appearance and thickness.
Show Only for Current Day Limits ORB lines to the current day when enabled.
Extend ORB Lines After Hours When enabled, extends the lines after the selected session; otherwise, they stop at session end.
Label Size / ORB Text Color Controls ORB label size and text color.
Show ORB Mid Line Shows or hides the midpoint of the opening range.
ORB Mid Color / Style / Width Controls the midpoint line's appearance.
Show Upper Targets (T1–T4) Enables the upper projected targets, subject to the RangeFlip direction and filtering rules.
Show Lower Targets (T1–T4) Enables the lower projected targets, subject to the RangeFlip direction and filtering rules.
Target Line Style / Target Line Width Controls how the target levels appear.
Target Method Linear uses equal spacing; Fibonacci uses custom ratios relative to half the ORB range.
T1 Ratio–T4 Ratio Customizes the four target ratios when Fibonacci mode is selected. Defaults: 1.618, 2.618, 3.618 and 4.236.
The special ORB target filter we added:
• Bullish bias: An upper target is shown only if its price is strictly above Range Low.
• Bearish bias: A lower target is shown only if its price is strictly below Flip Low.
• Each target is evaluated independently, so a target that fails its condition can be hidden while other qualifying targets remain visible.
This changes target visibility only; it does not change the target calculations or ratios.
05. Colors
Setting What it controls
Sell side / resistance Color for Range High and Flip High.
Buy side / support Color for Range Low and Flip Low.
Bullish signal Color for bullish bias, labels and related target references.
Bearish signal Color for bearish bias, labels and related stop references.
4. A practical starting configuration
For an initial setup, I would keep most defaults and focus on these:
• Chart timeframe: 15 minutes.
• Setup session: Choose the session you actually trade.
• Opening candle minimum body: Start at 50%.
• Range breach detection: Start with Wick to allow wick-based tests; consider Body if you want stricter confirmation of the breach.
• Setup window: 60 minutes initially; shorten it if you want to focus on earlier setups.
• Dashboard and entry/stop/target lines: Leave enabled while learning the signals.
• ORB duration: 15 minutes initially, and use the target filter to reduce clutter.
Review the behavior on historical charts and in paper trading before relying on the signals with real money. Also remember that enabling an alert condition in the indicator settings does not, by itself, create an active TradingView alert—you still need to configure the alert in TradingView.
Disclaimer
For educational and informational purposes only. RangeFlip [RF15] + ORB is a technical analysis tool intended to help users study price action, historical levels, potential trade setups, and opening range breakouts. It does not constitute financial, investment, or trading advice, nor is it a recommendation to buy or sell any security or financial instrument.
All trading involves risk, including the potential loss of your entire invested capital. Indicator signals, projected targets, and reward-to-risk calculations are not guarantees of future performance. Past performance does not guarantee future results.
Users are solely responsible for their trading decisions and should conduct their own research and risk assessment. Consider consulting a qualified financial professional before making investment decisions.
1. What the indicator does
RangeFlip [RF15] is a 15-minute trading indicator designed to identify potential bullish and bearish reversal setups around historical price levels during a selected trading session. The added Opening Range Breakout (ORB) module plots the session's opening range and projected target levels. This is usually helpful for intraday trading on Large/Mega caps, ETF's.
It combines three useful elements:
• Historical levels: Range High, Range Low, Flip High and Flip Low act as potential resistance and support reference points.
• RangeFlip signals: Looks for an opening-candle break of a historical level followed by an opposite-direction candle that confirms the setup.
• ORB levels and targets: Shows the opening range, midpoint and projected price targets to help assess potential breakout areas.
The indicator is a decision-support tool, not a guarantee of a profitable trade.
2. How to use it
Step 1 — Identify the important levels
Start with the four historical levels. Observe where the selected session's price action approaches, tests or breaks one of these levels.
Step 2 — Wait for the RangeFlip setup
The opening candle must meet the minimum body-size requirement and breach a historical level. A second, opposite-direction candle must confirm the setup. The indicator then identifies a potential bullish or bearish bias.
Step 3 — Assess the entry, stop and target
Use the dashboard's entry trigger, stop reference, target and reward/risk information alongside the ORB levels. A bullish entry trigger is based on the second candle's high; a bearish trigger is based on its low.
Step 4 — Apply your trade plan
Confirm that the potential trade has adequate room to its target, determine your position size and risk limit, and avoid treating an indicator signal as an automatic instruction to trade.
Important: The indicator is intended for a 15-minute chart. The selected session controls the setup timing and the ORB opening range. Check the dashboard's timeframe status before relying on a signal.
3. Configuration panel explained
01. Historical Levels
Setting What it controls
Days searched for flip levels Number of previous regular trading sessions searched for historical levels. Default: 250.
Line extension (chart bars) How far the historical level lines extend beyond the latest candle. Default: 5 bars.
Show level labels Shows or hides each available level's name and price.
02. Level Appearance
Setting What it controls
Level line style Solid, dashed or dotted lines.
Range line width Thickness of Range High and Range Low lines.
Flip line width Thickness of Flip High and Flip Low lines.
03. RangeFlip Rules
Setting What it controls
Setup session Selects the US, Asia, Europe or India session.
Opening candle minimum body (%) Minimum candle-body size as a percentage of its full high-low range. Default: 50%. A higher setting requires a stronger-bodied candle.
Range breach detection Wick: a high/low touch or cross can qualify. Body: the candle must open on one side and close beyond the level.
Setup window after session open Restricts qualifying setups to the first 15, 30, 45 or 60 minutes. Default: 60 minutes.
Show entry, stop and target lines Displays the trade-reference lines on the chart.
Show signal labels Displays the bullish or bearish RangeFlip label.
Enable bullish alerts Enables bullish alert conditions.
Enable bearish alerts Enables bearish alert conditions.
Enable dynamic alert() messages Enables alert messages containing details such as session, symbol and entry trigger.
04. Dashboard
The dashboard summarizes the current setup and recent signal information.
Setting What it controls
Display dashboard? Shows or hides the entire panel.
Show table header? Shows or hides the RANGEFLIP / RF15 heading.
Panel Position Places the panel at a supported chart corner or Middle Right.
Label Text Size Tiny, Small, Normal or Large.
Background Color / Default Text Color Adjusts dashboard appearance.
Show session row Displays the selected session.
Show recent signal history Displays recent signal history.
Signal history lookback (calendar days) Controls the history period, from 1 to 365 days; default: 15.
Show trade bias Displays Bullish, Bearish or No Trade.
Show setup status Displays whether the setup qualifies.
Show tested level Displays the historical level that was breached.
Show entry price Displays the entry trigger price.
Show stop reference Displays the tested level used as the stop reference.
Show target Displays the qualifying opposite historical level, when applicable.
Show reward/risk Displays the theoretical reward-to-risk ratio.
Show timeframe status Indicates whether the chart is on the required 15-minute timeframe.
The dashboard fields can be toggled individually to keep it compact. The reward/risk value is theoretical; it does not establish that a trade would fill at the trigger or achieve its target.
ORB — Opening Range Breakout
These settings control the opening range, its appearance and its projected targets.
Setting What it controls
Show ORB Lines Turns the ORB display on or off.
ORB High Color / ORB Low Color Sets the colors of the opening-range high and low.
ORB Duration (Minutes) Sets the opening-range duration from the selected session's regular open. Default: 15 minutes.
ORB Line Style / ORB Line Width Controls the opening-range line appearance and thickness.
Show Only for Current Day Limits ORB lines to the current day when enabled.
Extend ORB Lines After Hours When enabled, extends the lines after the selected session; otherwise, they stop at session end.
Label Size / ORB Text Color Controls ORB label size and text color.
Show ORB Mid Line Shows or hides the midpoint of the opening range.
ORB Mid Color / Style / Width Controls the midpoint line's appearance.
Show Upper Targets (T1–T4) Enables the upper projected targets, subject to the RangeFlip direction and filtering rules.
Show Lower Targets (T1–T4) Enables the lower projected targets, subject to the RangeFlip direction and filtering rules.
Target Line Style / Target Line Width Controls how the target levels appear.
Target Method Linear uses equal spacing; Fibonacci uses custom ratios relative to half the ORB range.
T1 Ratio–T4 Ratio Customizes the four target ratios when Fibonacci mode is selected. Defaults: 1.618, 2.618, 3.618 and 4.236.
The special ORB target filter we added:
• Bullish bias: An upper target is shown only if its price is strictly above Range Low.
• Bearish bias: A lower target is shown only if its price is strictly below Flip Low.
• Each target is evaluated independently, so a target that fails its condition can be hidden while other qualifying targets remain visible.
This changes target visibility only; it does not change the target calculations or ratios.
05. Colors
Setting What it controls
Sell side / resistance Color for Range High and Flip High.
Buy side / support Color for Range Low and Flip Low.
Bullish signal Color for bullish bias, labels and related target references.
Bearish signal Color for bearish bias, labels and related stop references.
4. A practical starting configuration
For an initial setup, I would keep most defaults and focus on these:
• Chart timeframe: 15 minutes.
• Setup session: Choose the session you actually trade.
• Opening candle minimum body: Start at 50%.
• Range breach detection: Start with Wick to allow wick-based tests; consider Body if you want stricter confirmation of the breach.
• Setup window: 60 minutes initially; shorten it if you want to focus on earlier setups.
• Dashboard and entry/stop/target lines: Leave enabled while learning the signals.
• ORB duration: 15 minutes initially, and use the target filter to reduce clutter.
Review the behavior on historical charts and in paper trading before relying on the signals with real money. Also remember that enabling an alert condition in the indicator settings does not, by itself, create an active TradingView alert—you still need to configure the alert in TradingView.
Disclaimer
For educational and informational purposes only. RangeFlip [RF15] + ORB is a technical analysis tool intended to help users study price action, historical levels, potential trade setups, and opening range breakouts. It does not constitute financial, investment, or trading advice, nor is it a recommendation to buy or sell any security or financial instrument.
All trading involves risk, including the potential loss of your entire invested capital. Indicator signals, projected targets, and reward-to-risk calculations are not guarantees of future performance. Past performance does not guarantee future results.
Users are solely responsible for their trading decisions and should conduct their own research and risk assessment. Consider consulting a qualified financial professional before making investment decisions.
Sürüm Notları
cosmetic changeSürüm Notları
Added Move Validation criteria as follows- Bias validation move (%): Default 0.5%, configurable from 0.5% to 10%.
- Bias validation window (minutes): Default 90 minutes, configurable from 15 to 240 minutes in 15-minute increments.
The Bias row will show Bullish-Invalid or Bearish-Invalid if the detected bias fails to reach its validation threshold within the configured window. The threshold is measured from the entry trigger: bullish validation uses the candle high, and bearish validation uses the candle low.
Sürüm Notları
Updated to show info regardless of selected intraday TF, all other calculations remain sameSürüm Notları

Feragatname
Bilgiler ve yayınlar, TradingView tarafından sağlanan veya onaylanan finansal, yatırım, alım satım veya diğer türden tavsiye veya öneriler anlamına gelmez ve teşkil etmez. Kullanım Koşulları bölümünde daha fazlasını okuyun.
Feragatname
Bilgiler ve yayınlar, TradingView tarafından sağlanan veya onaylanan finansal, yatırım, alım satım veya diğer türden tavsiye veya öneriler anlamına gelmez ve teşkil etmez. Kullanım Koşulları bölümünde daha fazlasını okuyun.