OPEN-SOURCE SCRIPT
Güncellendi Futrues Daily Pivot Zones
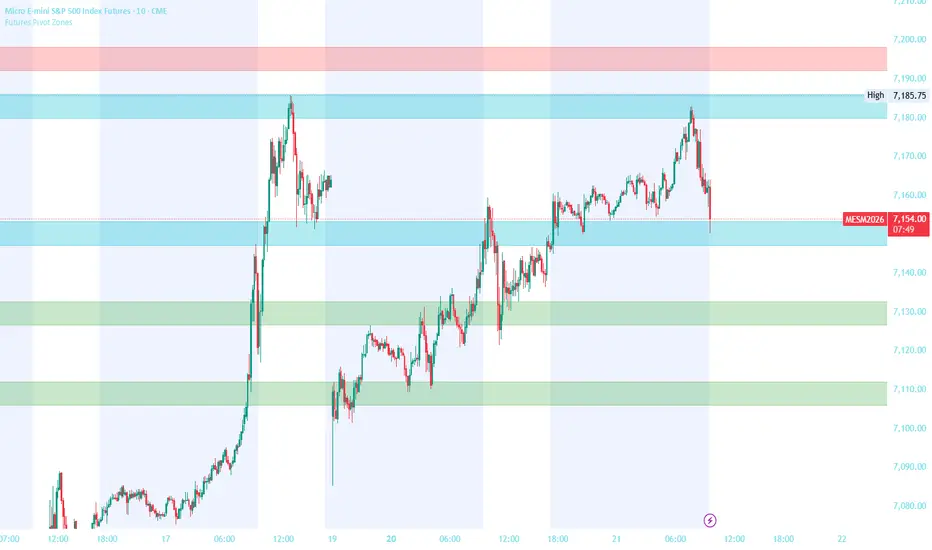
Automatically plots Daily Pivot Point levels as clean rectangle zones directly on your futures chart. Levels are calculated from the previous day's High, Low, and Close — the same levels watched by institutions, banks, and algorithms every single session.
Levels Included:
PP — Main Pivot Point (most watched level of the day)
R1, R2, R3 — Resistance zones above PP
S1, S2, S3 — Support zones below PP
PDH — Previous Day High
PDL — Previous Day Low
How To Use:
Look for price to reject or bounce off a zone in confluence with your EMA bias and VWAP direction. The more factors that agree at a zone — the stronger the trade.
Recommended Zone Buffer By Instrument:
MES (Micro E-Mini S&P 500) → 4.0 - 5.0 points
MNQ (Micro E-Mini Nasdaq) → 8.0 - 10.0 points
MGC (Micro Gold) → 15.0 - 20.0 points
MCL (Micro Crude Oil) → 0.15 - 0.25 points
M2K (Micro Russell 2000) → 3.0 - 4.0 points
Recommended Lookback:
750 bars on a 15-min chart covers approximately 3 trading days of price action.
Levels Included:
PP — Main Pivot Point (most watched level of the day)
R1, R2, R3 — Resistance zones above PP
S1, S2, S3 — Support zones below PP
PDH — Previous Day High
PDL — Previous Day Low
How To Use:
Look for price to reject or bounce off a zone in confluence with your EMA bias and VWAP direction. The more factors that agree at a zone — the stronger the trade.
Recommended Zone Buffer By Instrument:
MES (Micro E-Mini S&P 500) → 4.0 - 5.0 points
MNQ (Micro E-Mini Nasdaq) → 8.0 - 10.0 points
MGC (Micro Gold) → 15.0 - 20.0 points
MCL (Micro Crude Oil) → 0.15 - 0.25 points
M2K (Micro Russell 2000) → 3.0 - 4.0 points
Recommended Lookback:
750 bars on a 15-min chart covers approximately 3 trading days of price action.
Sürüm Notları
Automatically plots Daily Pivot Point levels as clean rectangle zones directly on your futures chart. Levels are calculated from the previous day's High, Low, and Close — the same levels watched by institutions, banks, and algorithms every single session.Levels Included:
PP — Main Pivot Point (most watched level of the day)
R1, R2, R3 — Resistance zones above PP
S1, S2, S3 — Support zones below PP
PDH — Previous Day High
PDL — Previous Day Low
How To Use:
Look for price to reject or bounce off a zone in confluence with your EMA bias and VWAP direction. The more factors that agree at a zone — the stronger the trade.
Recommended Zone Buffer By Instrument:
MES (Micro E-Mini S&P 500) → 4.0 - 5.0 points
MNQ (Micro E-Mini Nasdaq) → 8.0 - 10.0 points
MGC (Micro Gold) → 15.0 - 20.0 points
MCL (Micro Crude Oil) → 0.15 - 0.25 points
M2K (Micro Russell 2000) → 3.0 - 4.0 points
Recommended Lookback:
750 bars on a 15-min chart covers approximately 3 trading days of price action.
Sürüm Notları
updated colors and buffer and fixed spellingSürüm Notları
fixed spelling and updated colors and bufferSürüm Notları
updatedAçık kaynak kodlu komut dosyası
Gerçek TradingView ruhuyla, bu komut dosyasının mimarı, yatırımcıların işlevselliğini inceleyip doğrulayabilmesi için onu açık kaynaklı hale getirdi. Yazarı tebrik ederiz! Ücretsiz olarak kullanabilseniz de, kodu yeniden yayınlamanın Topluluk Kurallarımıza tabi olduğunu unutmayın.

Feragatname
Bilgiler ve yayınlar, TradingView tarafından sağlanan veya onaylanan finansal, yatırım, alım satım veya diğer türden tavsiye veya öneriler anlamına gelmez ve teşkil etmez. Kullanım Koşulları bölümünde daha fazlasını okuyun.
Açık kaynak kodlu komut dosyası
Gerçek TradingView ruhuyla, bu komut dosyasının mimarı, yatırımcıların işlevselliğini inceleyip doğrulayabilmesi için onu açık kaynaklı hale getirdi. Yazarı tebrik ederiz! Ücretsiz olarak kullanabilseniz de, kodu yeniden yayınlamanın Topluluk Kurallarımıza tabi olduğunu unutmayın.
Feragatname
Bilgiler ve yayınlar, TradingView tarafından sağlanan veya onaylanan finansal, yatırım, alım satım veya diğer türden tavsiye veya öneriler anlamına gelmez ve teşkil etmez. Kullanım Koşulları bölümünde daha fazlasını okuyun.