Sonny Dual MA System
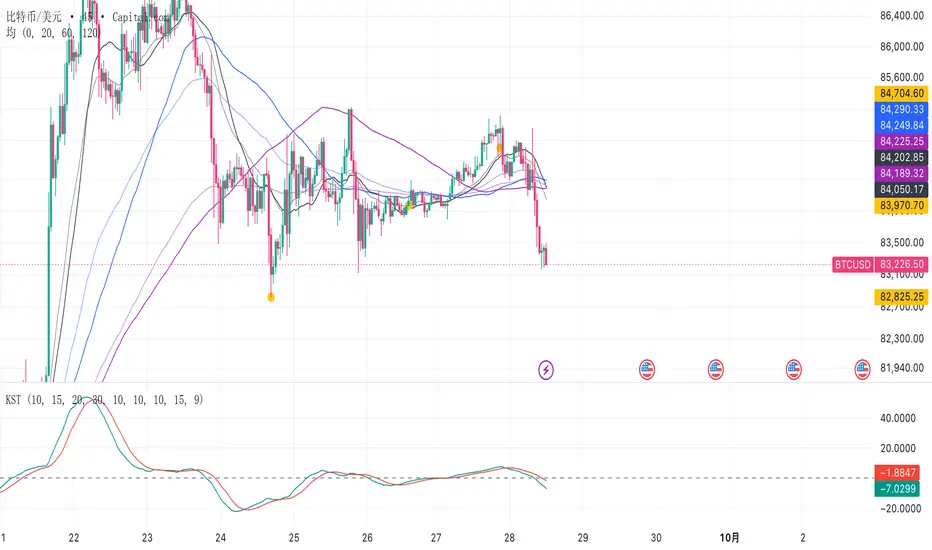
Sonny Dual MA System is a clean trend-following indicator designed to provide a simple visual framework for identifying short-, medium-, and long-term market trends.
The indicator combines Simple Moving Averages (SMA) and Exponential Moving Averages (EMA) across three key periods:
* 20 MA — Short-term trend
* 60 MA — Medium-term trend
* 120 MA — Long-term trend
Each period displays both an SMA and EMA, allowing traders to compare the smoother trend structure of the SMA with the faster price response of the EMA.
How to Read It
When shorter-period moving averages are positioned above longer-period averages, the market generally shows a stronger bullish structure.
When shorter-period moving averages are positioned below longer-period averages, the market generally shows a stronger bearish structure.
The relationship between the SMA and EMA within each period can also help visualize changes in momentum and potential trend transitions.
Historical Reference Dots
The yellow dots mark the price location from 20, 60, and 120 bars ago, providing a quick visual reference for comparing current price action with previous market structure.
Features
• SMA 20 / EMA 20
• SMA 60 / EMA 60
• SMA 120 / EMA 120
• Short-, medium-, and long-term trend visualization
• Historical 20 / 60 / 120-bar reference markers
• Designed for clean chart analysis across multiple timeframes
This indicator is intended as a market structure and trend visualization tool rather than a standalone buy or sell signal system.
For educational and informational purposes only.
The indicator combines Simple Moving Averages (SMA) and Exponential Moving Averages (EMA) across three key periods:
* 20 MA — Short-term trend
* 60 MA — Medium-term trend
* 120 MA — Long-term trend
Each period displays both an SMA and EMA, allowing traders to compare the smoother trend structure of the SMA with the faster price response of the EMA.
How to Read It
When shorter-period moving averages are positioned above longer-period averages, the market generally shows a stronger bullish structure.
When shorter-period moving averages are positioned below longer-period averages, the market generally shows a stronger bearish structure.
The relationship between the SMA and EMA within each period can also help visualize changes in momentum and potential trend transitions.
Historical Reference Dots
The yellow dots mark the price location from 20, 60, and 120 bars ago, providing a quick visual reference for comparing current price action with previous market structure.
Features
• SMA 20 / EMA 20
• SMA 60 / EMA 60
• SMA 120 / EMA 120
• Short-, medium-, and long-term trend visualization
• Historical 20 / 60 / 120-bar reference markers
• Designed for clean chart analysis across multiple timeframes
This indicator is intended as a market structure and trend visualization tool rather than a standalone buy or sell signal system.
For educational and informational purposes only.

Feragatname
Bilgiler ve yayınlar, TradingView tarafından sağlanan veya onaylanan finansal, yatırım, alım satım veya diğer türden tavsiye veya öneriler anlamına gelmez ve teşkil etmez. Kullanım Koşulları bölümünde daha fazlasını okuyun.
Feragatname
Bilgiler ve yayınlar, TradingView tarafından sağlanan veya onaylanan finansal, yatırım, alım satım veya diğer türden tavsiye veya öneriler anlamına gelmez ve teşkil etmez. Kullanım Koşulları bölümünde daha fazlasını okuyun.