OPEN-SOURCE SCRIPT
Güncellendi LiquidityMap
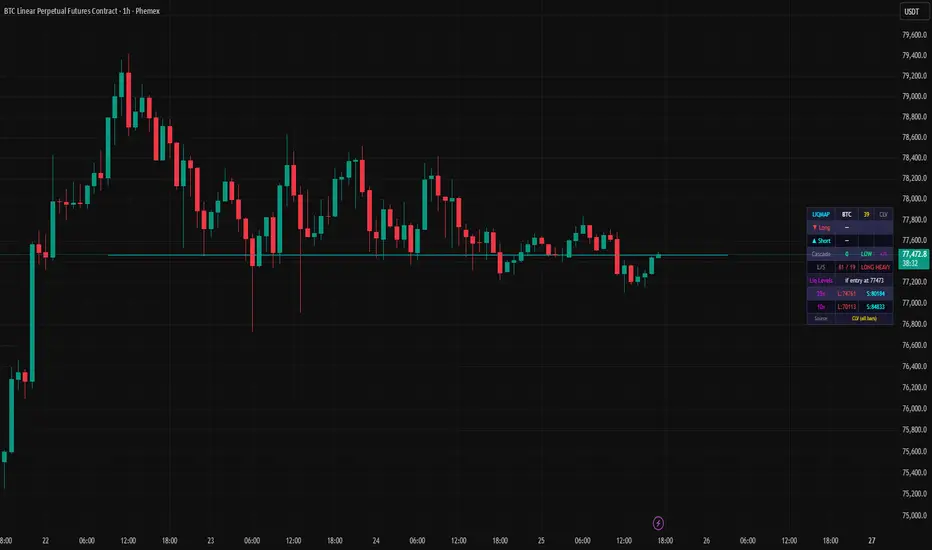
LiquidityMap v1.1 — Liquidation Cluster Heatmap with Footprint Integration
LiquidityMap estimates where leveraged positions would get liquidated by tracking where they were opened and projecting their forced-exit prices at four leverage tiers. The result is a heatmap overlay that reveals the structural cascade risk around current price — where the liquidation landmines are buried.
HOW IT WORKS
The indicator scans a configurable lookback window (default 200 bars) for bars where two conditions are met simultaneously: open interest expanded (new positions entered the market) AND volume was at or above its 20-bar average (the entries carried conviction, not just noise). These are classified as "entry bars" — moments when traders committed capital at a specific price.
Each entry bar is classified as long or short. In v1.1, this classification uses TradingView's request.footprint() function to determine actual buy vs sell pressure via volume delta. When footprint data shows positive delta (more buying than selling), the bar is classified as a long entry. Negative delta classifies it as a short entry. This is a significant improvement over the v1.0 approach of using candle color, which is a rough proxy at best — a green candle during a selloff can mask aggressive short entries that happened to close slightly above open. On plans without footprint access (Free/Essential), the indicator falls back to candle color automatically.
For each detected entry, LiquidityMap projects where those positions would get liquidated at four leverage tiers: 10x, 25x, 50x, and 100x. The liquidation formula accounts for maintenance margin (default 0.5% for Phemex). Each tier is weighted by estimated trader distribution — default is 35% at 10x, 35% at 25x, 20% at 50x, and 10% at 100x, reflecting that most retail traders use moderate leverage. The projected liquidation prices are then accumulated into price bins to create a density map.
READING THE HEATMAP
Red and orange zones below price represent long liquidation clusters. If price drops into these zones, long positions at those leverage tiers get forcefully closed. The forced selling creates additional downward pressure, which can trigger more liquidations at slightly lower prices — this is the cascade effect. Brighter, more opaque zones indicate denser clusters where more liquidation volume is concentrated.
Cyan and teal zones above price represent short liquidation clusters. Price rising into these zones forces shorts to cover, adding buy pressure that can accelerate a squeeze. Dense cyan zones above price are squeeze fuel.
Dashed reference lines mark the nearest significant liquidation zone in each direction, with a label showing the exact price level and percentage distance from current price.
CONVICTION WEIGHTING
When footprint data is available, entries are weighted not just by OI magnitude and volume intensity but also by delta conviction — how lopsided the buy/sell split was on that bar. A bar where 80% of volume was buying gets a stronger long-entry weight than a bar where the split was 52/48. This makes the density map proportional to actual directional conviction, not just raw OI expansion.
THE INFO TABLE
The table provides a compact summary of the liquidation landscape. The header row shows the asset, number of detected entries, and the active classification source (FP for footprint, or candle for fallback mode). The Long and Short rows show the nearest significant liquidation zone with its price, percentage distance from current price, and relative density. The Cascade row scores how much total liquidation density sits within a configurable percentage range of current price (default ±3%), classified as LOW, MODERATE, HIGH, or EXTREME. The L/S row shows the ratio of long vs short entry weight, indicating which side of the market is more exposed. Reference rows at the bottom show where you would get liquidated at 10x and 25x leverage if you entered a position right now. The Source row shows how many entry bars used footprint classification vs candle color fallback.
INPUTS AND CONFIGURATION
The OI data source defaults to Binance linear perpetuals. The lookback window controls how many bars of history are scanned for entries — 200 on 1H covers about 8 days, 200 on Daily covers about 9 months. The volume threshold (default 1.0x SMA20) filters out low-conviction entries. Leverage tiers and their probability weights are fully configurable. The heatmap resolution (number of price bins), zone width, and minimum density floor control the visual output. The cascade zone percentage, minimum line distance, and minimum line density threshold control which zones get reference lines drawn.
Footprint settings include ticks per row (default 100) and Value Area percentage (default 70%). The footprint toggle allows disabling the feature entirely for compatibility with Free/Essential plans.
WHAT THIS IS NOT
LiquidityMap is an estimation tool, not a prediction engine. It does not have access to actual exchange order books or real liquidation data — those require platforms like CoinGlass or Hyblock Capital. What it does is build a probabilistic model of where liquidations are likely concentrated based on observable on-chain signals (OI expansion, volume, and footprint delta). Validation against CoinGlass liquidation maps shows strong alignment in identifying major cluster zones, though absolute density values will differ since CoinGlass has direct exchange data.
OI data is sourced from Binance via the standard BINANCE:SYMBOL+USDT.P_OI ticker. Assets without Binance OI data will not produce results. The footprint feature requires a TradingView Premium or Ultimate subscription.
LiquidityMap estimates where leveraged positions would get liquidated by tracking where they were opened and projecting their forced-exit prices at four leverage tiers. The result is a heatmap overlay that reveals the structural cascade risk around current price — where the liquidation landmines are buried.
HOW IT WORKS
The indicator scans a configurable lookback window (default 200 bars) for bars where two conditions are met simultaneously: open interest expanded (new positions entered the market) AND volume was at or above its 20-bar average (the entries carried conviction, not just noise). These are classified as "entry bars" — moments when traders committed capital at a specific price.
Each entry bar is classified as long or short. In v1.1, this classification uses TradingView's request.footprint() function to determine actual buy vs sell pressure via volume delta. When footprint data shows positive delta (more buying than selling), the bar is classified as a long entry. Negative delta classifies it as a short entry. This is a significant improvement over the v1.0 approach of using candle color, which is a rough proxy at best — a green candle during a selloff can mask aggressive short entries that happened to close slightly above open. On plans without footprint access (Free/Essential), the indicator falls back to candle color automatically.
For each detected entry, LiquidityMap projects where those positions would get liquidated at four leverage tiers: 10x, 25x, 50x, and 100x. The liquidation formula accounts for maintenance margin (default 0.5% for Phemex). Each tier is weighted by estimated trader distribution — default is 35% at 10x, 35% at 25x, 20% at 50x, and 10% at 100x, reflecting that most retail traders use moderate leverage. The projected liquidation prices are then accumulated into price bins to create a density map.
READING THE HEATMAP
Red and orange zones below price represent long liquidation clusters. If price drops into these zones, long positions at those leverage tiers get forcefully closed. The forced selling creates additional downward pressure, which can trigger more liquidations at slightly lower prices — this is the cascade effect. Brighter, more opaque zones indicate denser clusters where more liquidation volume is concentrated.
Cyan and teal zones above price represent short liquidation clusters. Price rising into these zones forces shorts to cover, adding buy pressure that can accelerate a squeeze. Dense cyan zones above price are squeeze fuel.
Dashed reference lines mark the nearest significant liquidation zone in each direction, with a label showing the exact price level and percentage distance from current price.
CONVICTION WEIGHTING
When footprint data is available, entries are weighted not just by OI magnitude and volume intensity but also by delta conviction — how lopsided the buy/sell split was on that bar. A bar where 80% of volume was buying gets a stronger long-entry weight than a bar where the split was 52/48. This makes the density map proportional to actual directional conviction, not just raw OI expansion.
THE INFO TABLE
The table provides a compact summary of the liquidation landscape. The header row shows the asset, number of detected entries, and the active classification source (FP for footprint, or candle for fallback mode). The Long and Short rows show the nearest significant liquidation zone with its price, percentage distance from current price, and relative density. The Cascade row scores how much total liquidation density sits within a configurable percentage range of current price (default ±3%), classified as LOW, MODERATE, HIGH, or EXTREME. The L/S row shows the ratio of long vs short entry weight, indicating which side of the market is more exposed. Reference rows at the bottom show where you would get liquidated at 10x and 25x leverage if you entered a position right now. The Source row shows how many entry bars used footprint classification vs candle color fallback.
INPUTS AND CONFIGURATION
The OI data source defaults to Binance linear perpetuals. The lookback window controls how many bars of history are scanned for entries — 200 on 1H covers about 8 days, 200 on Daily covers about 9 months. The volume threshold (default 1.0x SMA20) filters out low-conviction entries. Leverage tiers and their probability weights are fully configurable. The heatmap resolution (number of price bins), zone width, and minimum density floor control the visual output. The cascade zone percentage, minimum line distance, and minimum line density threshold control which zones get reference lines drawn.
Footprint settings include ticks per row (default 100) and Value Area percentage (default 70%). The footprint toggle allows disabling the feature entirely for compatibility with Free/Essential plans.
WHAT THIS IS NOT
LiquidityMap is an estimation tool, not a prediction engine. It does not have access to actual exchange order books or real liquidation data — those require platforms like CoinGlass or Hyblock Capital. What it does is build a probabilistic model of where liquidations are likely concentrated based on observable on-chain signals (OI expansion, volume, and footprint delta). Validation against CoinGlass liquidation maps shows strong alignment in identifying major cluster zones, though absolute density values will differ since CoinGlass has direct exchange data.
OI data is sourced from Binance via the standard BINANCE:SYMBOL+USDT.P_OI ticker. Assets without Binance OI data will not produce results. The footprint feature requires a TradingView Premium or Ultimate subscription.
Sürüm Notları
cosmeticSürüm Notları
cosmeticSürüm Notları
cosmeticSürüm Notları
cosmeticAçık kaynak kodlu komut dosyası
Gerçek TradingView ruhuyla, bu komut dosyasının mimarı, yatırımcıların işlevselliğini inceleyip doğrulayabilmesi için onu açık kaynaklı hale getirdi. Yazarı tebrik ederiz! Ücretsiz olarak kullanabilseniz de, kodu yeniden yayınlamanın Topluluk Kurallarımıza tabi olduğunu unutmayın.

Feragatname
Bilgiler ve yayınlar, TradingView tarafından sağlanan veya onaylanan finansal, yatırım, alım satım veya diğer türden tavsiye veya öneriler anlamına gelmez ve teşkil etmez. Kullanım Koşulları bölümünde daha fazlasını okuyun.
Açık kaynak kodlu komut dosyası
Gerçek TradingView ruhuyla, bu komut dosyasının mimarı, yatırımcıların işlevselliğini inceleyip doğrulayabilmesi için onu açık kaynaklı hale getirdi. Yazarı tebrik ederiz! Ücretsiz olarak kullanabilseniz de, kodu yeniden yayınlamanın Topluluk Kurallarımıza tabi olduğunu unutmayın.
Feragatname
Bilgiler ve yayınlar, TradingView tarafından sağlanan veya onaylanan finansal, yatırım, alım satım veya diğer türden tavsiye veya öneriler anlamına gelmez ve teşkil etmez. Kullanım Koşulları bölümünde daha fazlasını okuyun.