Volume Acceptance Bands [PhenLabs]
Volume Acceptance Bands [PhenLabs]
v1.0 — Volume cluster detection with 3-state adaptive breakout bands

📌 OVERVIEW
Volume Acceptance Bands uses statistical volume anomaly detection to identify price levels where the market has temporarily “accepted” a range — then tracks what happens when that acceptance breaks. Every bar is assigned one of three exclusive states: Acceptance, Expansion, or Mean-Revert, giving you a clear read on whether the market is building energy, breaking out, or rejecting a move.
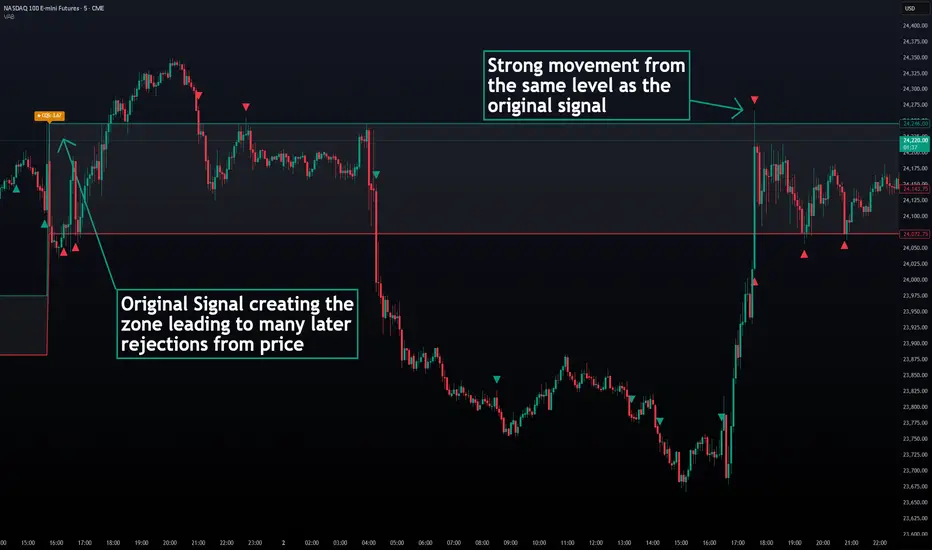
The core mechanism is a rolling z-score applied to volume. When volume spikes above a configurable threshold for a configurable number of consecutive bars, those bars form a “cluster” and their combined high/low becomes the acceptance range. The bands persist on the chart until the next qualifying cluster overwrites them.
📊 HOW IT WORKS
v1.0 — Volume cluster detection with 3-state adaptive breakout bands
📌 OVERVIEW
Volume Acceptance Bands uses statistical volume anomaly detection to identify price levels where the market has temporarily “accepted” a range — then tracks what happens when that acceptance breaks. Every bar is assigned one of three exclusive states: Acceptance, Expansion, or Mean-Revert, giving you a clear read on whether the market is building energy, breaking out, or rejecting a move.
The core mechanism is a rolling z-score applied to volume. When volume spikes above a configurable threshold for a configurable number of consecutive bars, those bars form a “cluster” and their combined high/low becomes the acceptance range. The bands persist on the chart until the next qualifying cluster overwrites them.
📊 HOW IT WORKS
- Z-Score Computation
- Each bar’s volume is normalized against a rolling mean and standard deviation over the lookback period
- A bar is flagged as a spike when its z-score exceeds the threshold (default: 2.0)
- Zero-stdev environments (flat volume) are safely handled to prevent division errors
- Cluster Formation
- Consecutive spike bars accumulate into a cluster
- The cluster’s high/low envelope is tracked in real time
- Once the cluster reaches the minimum duration (default: 2 bars), the acceptance range locks in
- A non-spike bar resets the cluster tracker
- Cluster Quality Score (CQS)
- Displayed as a label the moment a new cluster locks in
- Formula: CQS = volume z-score × wick rejection ratio
- Wick rejection ratio measures how strongly price closed toward one extreme of the spike bar
- Higher CQS = stronger cluster = more meaningful acceptance zone
- Three-State Classification
- Acceptance: Price is inside the acceptance range — neutral background, no signal
- Expansion: Price closes (or wicks, user-configurable) beyond the band with optional volume confirmation — bullish teal background + triangle marker
- Mean-Revert: Price breaches a band but closes back inside — bearish red background + triangle marker
- Anti-Repaint Design
- All state assignments and signal markers fire inside barstate.isconfirmed
- No request.security calls — no lookahead of any kind
🔑 POINTS OF INNOVATION- Z-score volume anomaly detection — statistically principled, not a simple MA multiple
- Three-state regime classifier with per-state visual identity (Acceptance / Expansion / Mean-Revert)
- Cluster Quality Score — original composite metric combining volume strength and wick rejection
- Persistent acceptance range — survives until the next qualifying cluster overwrites it
- Breakout confirmation toggle — close-beyond vs wick-beyond prevents wick trap false signals
- Volume confirmation gate for Expansion — optional requirement that breakout bars are themselves volume spikes
🔧 SETTINGS
Volume Cluster Detection- Volume Lookback | Default: 20 | Range: 5–200 | Bars used to compute the rolling z-score baseline
- Z-Score Threshold | Default: 2.0 | Range: 0.5–6.0 | Minimum z-score to classify a bar as a volume spike. Higher = rarer clusters
- Min Cluster Duration | Default: 2 | Range: 1–20 | Consecutive spike bars required to lock in an acceptance range
Breakout Confirmation- Require Close Beyond Band | Default: ON | ON = breakout requires a close beyond the band; OFF = a wick is sufficient
- Require Volume Confirmation for Expansion | Default: ON | Expansion signals also require the breakout bar to be a volume spike
Display- Background Shading | Default: ON | Shades chart background by current market state
- Show Cluster Quality Score | Default: ON | Shows CQS label when a new cluster locks in
- Show Expansion / Mean-Revert Signals | Default: ON | Triangle markers on state-change bars
Colors- Acceptance Background, Expansion Background, Mean-Revert Background
- Upper Band, Lower Band, Band Fill
- Expansion Signal, Mean-Revert Signal
🔥 ALERTS- VAB — Expansion Breakout: fires on confirmed Expansion state bars
- VAB — Mean-Revert Rejection: fires on confirmed Mean-Revert state bars
- VAB — New Cluster Locked: fires the bar a new acceptance zone is established (includes CQS value in message)
🎨 VISUAL GUIDE- Teal upper band = acceptance zone ceiling
- Red lower band = acceptance zone floor
- Filled channel = the active acceptance range
- Teal background = Expansion (confirmed breakout)
- Red background = Mean-Revert (failed breakout / rejection)
- Neutral/gray background = Acceptance (price inside range)
- Orange label = Cluster Quality Score fires when a new zone is established
📖 USAGE NOTES- Works on all markets with reliable volume data: equities, crypto, futures, forex
- Best on 15m, 1H, 4H, and Daily timeframes where volume clusters are most meaningful
- A higher Z-Score Threshold (3.0+) produces fewer but higher-conviction clusters — useful on higher timeframes
- A lower Z-Score Threshold (1.5–1.8) produces more clusters — useful for scalping on lower timeframes
- CQS above 1.5 generally indicates a high-conviction acceptance zone worth watching
- Combine with a trend filter: take Expansion signals in the direction of the prevailing trend only
✅ WORKS WELL WITH- Trend filters (EMA, VWAP) to qualify Expansion direction
- Support/resistance zones to anticipate Mean-Revert locations
- Volatility tools (ATR-based) to size positions on Expansion breakouts
⚠️ DISCLAIMER
This indicator is for educational and research purposes only. It is not financial advice and does not constitute a trading recommendation. Past performance in backtests or historical evaluations does not guarantee future results. Always conduct your own due diligence before making any trading or investment decisions.

TradingView Charting w/ Crypto Systems: phenlabs.com
Join our growing community: discord.gg/phen
All content provided by PhenLabs is for informational & educational purposes only. Past performance does not guarantee future results.
Join our growing community: discord.gg/phen
All content provided by PhenLabs is for informational & educational purposes only. Past performance does not guarantee future results.
Feragatname
Bilgiler ve yayınlar, TradingView tarafından sağlanan veya onaylanan finansal, yatırım, alım satım veya diğer türden tavsiye veya öneriler anlamına gelmez ve teşkil etmez. Kullanım Koşulları bölümünde daha fazlasını okuyun.