Range by bigmm
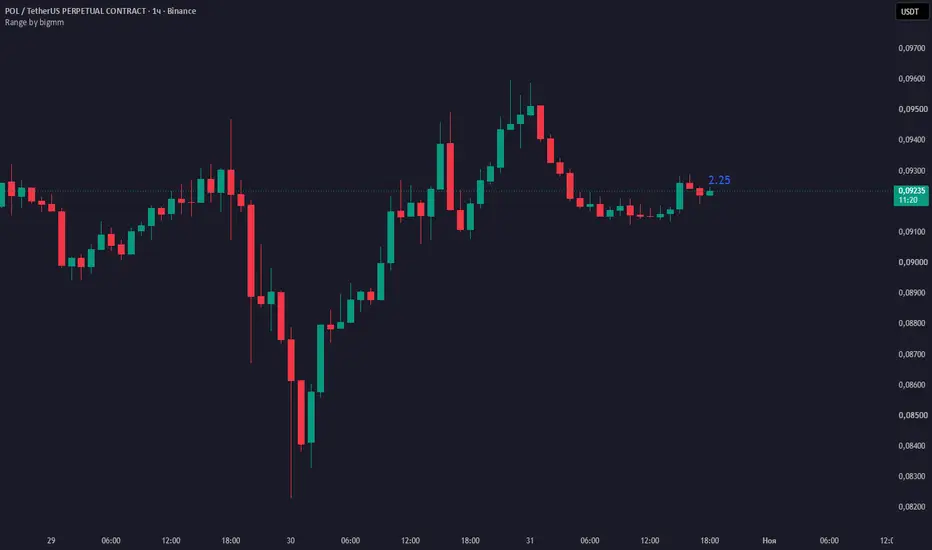
Range by bigmm calculates the square root of the percentage range of price movement over a user-selected timeframe (daily by default). The range is defined as the percentage change from the lowest price to the highest price over the chosen timeframe:
√( ((High_TF − Low_TF) / Low_TF) × 100 )
The indicator then takes the square root of this percentage value and displays the result as a blue, bold number fixed at the high of the current bar. The value is recalculated on every bar and updated only on the last bar, so the chart stays clean and efficient.
The result is formatted with exactly two decimal places (for example, 2.45). No future data is used, making the calculation safe for real-time and historical analysis.
The indicator provides a normalized volatility estimate as a percentage. It doesn't predict direction, but rather shows the expected amplitude of future price movement over a comparable horizon (the selected timeframe).
Key features:
√( ((High_TF − Low_TF) / Low_TF) × 100 )
The indicator then takes the square root of this percentage value and displays the result as a blue, bold number fixed at the high of the current bar. The value is recalculated on every bar and updated only on the last bar, so the chart stays clean and efficient.
The result is formatted with exactly two decimal places (for example, 2.45). No future data is used, making the calculation safe for real-time and historical analysis.
The indicator provides a normalized volatility estimate as a percentage. It doesn't predict direction, but rather shows the expected amplitude of future price movement over a comparable horizon (the selected timeframe).
Key features:
- User-selectable timeframe for the range calculation (default: Daily)
- Calculates the square root of the percentage high-low range
- Displays the value as a blue bold number at the current bar’s high
- Fixed position on the last bar only
- Two-decimal precision
- No repainting from future data
- Works as an overlay on the price chart

Bigmm Trading System (BTS) - это прибыльная система торговли по нескольким торговым стратегиям (TC).
Каждая ТС включает в себя работу с приватными индикаторами by bigmm.
Доступ и внедрение торговых стратегий платный.
Каждая ТС включает в себя работу с приватными индикаторами by bigmm.
Доступ и внедрение торговых стратегий платный.
Feragatname
Bilgiler ve yayınlar, TradingView tarafından sağlanan veya onaylanan finansal, yatırım, alım satım veya diğer türden tavsiye veya öneriler anlamına gelmez ve teşkil etmez. Kullanım Koşulları bölümünde daha fazlasını okuyun.
Bigmm Trading System (BTS) - это прибыльная система торговли по нескольким торговым стратегиям (TC).
Каждая ТС включает в себя работу с приватными индикаторами by bigmm.
Доступ и внедрение торговых стратегий платный.
Каждая ТС включает в себя работу с приватными индикаторами by bigmm.
Доступ и внедрение торговых стратегий платный.
Feragatname
Bilgiler ve yayınlar, TradingView tarafından sağlanan veya onaylanan finansal, yatırım, alım satım veya diğer türden tavsiye veya öneriler anlamına gelmez ve teşkil etmez. Kullanım Koşulları bölümünde daha fazlasını okuyun.