Price Volume Divergence State (PVDS)
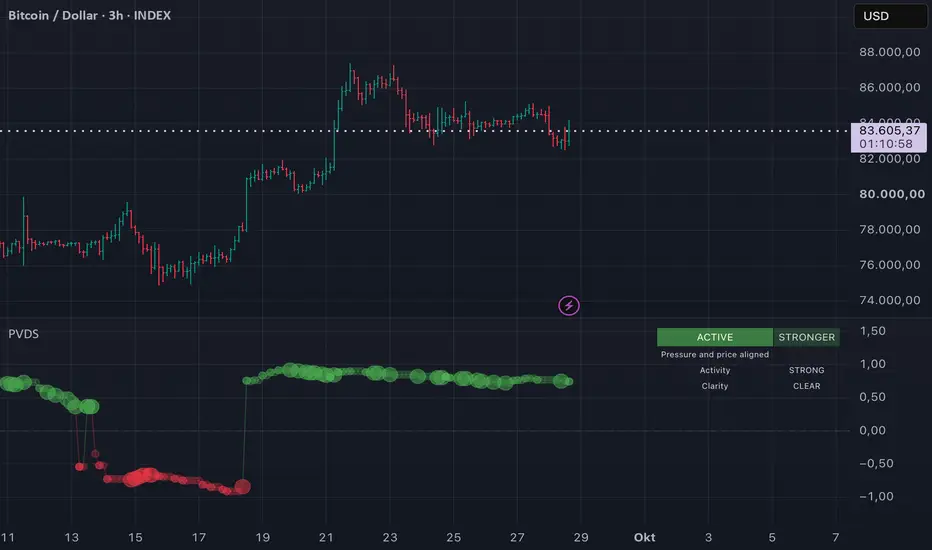
Price Volume Divergence State (PVDS)
Overview
PVDS is an open-source price-volume state indicator designed to describe how the underlying PVD process is behaving now.
Where an oscillator shows magnitude and direction, PVDS organizes price-volume information into recognizable process states. Its purpose is to make changes in market behavior easier to interpret without turning those states into automatic trade signals.
PVDS is the state-classification layer of the PVD Ecosystem. It focuses on the condition and development of the price-volume process rather than on forecasting future prices.
What it shows
PVDS is displayed in a separate pane as a continuous state series.
The process can move through states such as:
• Accumulation
• Release
• Active
• Weakening
• Transition
• Neutral
The visual direction remains simple:
• green states are above neutral;
• red states are below neutral;
• grey represents neutral or unresolved conditions.
Brightness reflects how clearly the current state is supported. Larger markers may appear when release behavior becomes more pronounced.
How to read it
PVDS should be interpreted as a description of process behavior.
• Accumulation suggests that price-volume pressure is building.
• Release suggests that stored pressure is being expressed.
• Active indicates a more established price-volume process.
• Weakening indicates loss of support in the current process.
• Transition indicates that the state is changing or not yet clearly resolved.
• Neutral indicates that no meaningful directional state is established.
These states are analytical descriptions, not buy or sell instructions.
Role in the PVD Ecosystem
PVDS answers the question:
What kind of price-volume process is currently taking place?
Its role is to add structure to raw price-volume pressure by identifying whether the process is building, releasing, active, weakening, transitioning, or neutral. It is intentionally kept separate from momentum and forward projection.
Originality
PVDS uses an original state-classification framework built from normalized price-volume pressure, stored imbalance, directional agreement, process evidence, and state continuity.
The state machine is designed to reduce unnecessary state flipping and to preserve continuity when the underlying evidence has not changed sufficiently.
The script is published open source so users can inspect the logic and understand how the states are formed.
Limitations
PVDS does not predict future market direction and does not provide guaranteed entry or exit signals.
State transitions can occur before or after visible price turning points because the indicator is describing an evolving process rather than attempting to call exact tops or bottoms.
Results depend on the quality of the underlying price and volume data and can vary by symbol, exchange, and timeframe.
PVDS should be used together with market context, independent judgment, and appropriate risk management.
Overview
PVDS is an open-source price-volume state indicator designed to describe how the underlying PVD process is behaving now.
Where an oscillator shows magnitude and direction, PVDS organizes price-volume information into recognizable process states. Its purpose is to make changes in market behavior easier to interpret without turning those states into automatic trade signals.
PVDS is the state-classification layer of the PVD Ecosystem. It focuses on the condition and development of the price-volume process rather than on forecasting future prices.
What it shows
PVDS is displayed in a separate pane as a continuous state series.
The process can move through states such as:
• Accumulation
• Release
• Active
• Weakening
• Transition
• Neutral
The visual direction remains simple:
• green states are above neutral;
• red states are below neutral;
• grey represents neutral or unresolved conditions.
Brightness reflects how clearly the current state is supported. Larger markers may appear when release behavior becomes more pronounced.
How to read it
PVDS should be interpreted as a description of process behavior.
• Accumulation suggests that price-volume pressure is building.
• Release suggests that stored pressure is being expressed.
• Active indicates a more established price-volume process.
• Weakening indicates loss of support in the current process.
• Transition indicates that the state is changing or not yet clearly resolved.
• Neutral indicates that no meaningful directional state is established.
These states are analytical descriptions, not buy or sell instructions.
Role in the PVD Ecosystem
PVDS answers the question:
What kind of price-volume process is currently taking place?
Its role is to add structure to raw price-volume pressure by identifying whether the process is building, releasing, active, weakening, transitioning, or neutral. It is intentionally kept separate from momentum and forward projection.
Originality
PVDS uses an original state-classification framework built from normalized price-volume pressure, stored imbalance, directional agreement, process evidence, and state continuity.
The state machine is designed to reduce unnecessary state flipping and to preserve continuity when the underlying evidence has not changed sufficiently.
The script is published open source so users can inspect the logic and understand how the states are formed.
Limitations
PVDS does not predict future market direction and does not provide guaranteed entry or exit signals.
State transitions can occur before or after visible price turning points because the indicator is describing an evolving process rather than attempting to call exact tops or bottoms.
Results depend on the quality of the underlying price and volume data and can vary by symbol, exchange, and timeframe.
PVDS should be used together with market context, independent judgment, and appropriate risk management.

Feragatname
Bilgiler ve yayınlar, TradingView tarafından sağlanan veya onaylanan finansal, yatırım, alım satım veya diğer türden tavsiye veya öneriler anlamına gelmez ve teşkil etmez. Kullanım Koşulları bölümünde daha fazlasını okuyun.
Feragatname
Bilgiler ve yayınlar, TradingView tarafından sağlanan veya onaylanan finansal, yatırım, alım satım veya diğer türden tavsiye veya öneriler anlamına gelmez ve teşkil etmez. Kullanım Koşulları bölümünde daha fazlasını okuyun.