OPEN-SOURCE SCRIPT
Momentum Leader Scanner - Ashish
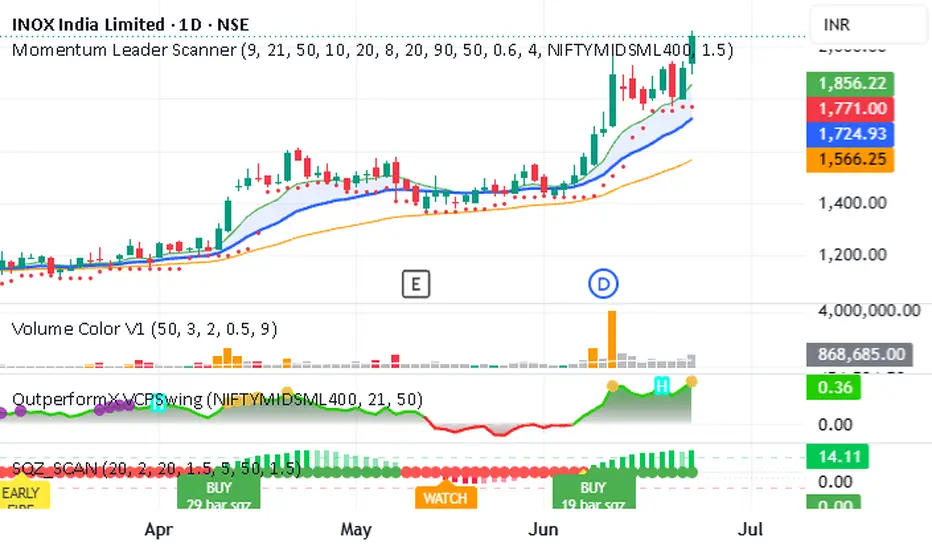
Momentum Leader Scanner — a systematic tool for catching high-conviction momentum stocks after their initial breakout (EP candle), while they consolidate quietly in the EMA9/21 cloud before the next leg up. Combines relative strength vs. benchmark, proximity to 52-week highs, and a low-volume pullback filter to surface coiled setups — then locks a precise breakout trigger price the moment a setup is confirmed, so you can place your entry order in advance instead of reacting after the move has already started.
How it works
The script anchors its analysis to the most recent qualifying EP candle (a single-day move of 8%+ by default) and measures the stock's outperformance against a benchmark (default: NIFTYMIDSML400) since that candle — not over an arbitrary fixed window. This avoids one EP candle alone inflating a "strength" reading; the outperformance has to be sustained after the move, not just caused by it.
A setup requires four conditions together:
Outperformance vs benchmark since the EP candle exceeds a minimum threshold (default 10%)
Proximity to 52-week high (default within 20%) — confirming the stock hasn't lost its leadership
A qualifying EP candle within the detection window
A healthy pullback — price sitting inside the EMA9/EMA21 cloud (with a small tolerance for wick excursions) while the EMA9 > EMA21 > EMA50 stack stays intact, on below-average volume
When all four align, the script locks a breakout trigger price — the highest high since the EP candle — letting you pre-place a GTT order rather than waiting for a confirmed close above resistance, which is often a day or more late.
What it's good for
Catching stocks in the "coil after the jump" phase: violent move, quiet digestion, then continuation. It explicitly tracks how many separate EP candles have fired (visible as a diagnostic) so you can judge whether a stock had one clean catalyst or has been repeatedly volatile.
What it isn't built for
Slow, low-volatility grinders that never have a sharp EP candle (a different system altogether), and stocks that move too fast and too cleanly to ever pull back into the cloud on a daily timeframe.
Status
Actively used and refined against live market data — published as-is for traders who understand swing/momentum trading and want to incorporate systematic outperformance and pullback logic into their own process. Not financial advice; verify every signal against your own risk management before acting on it.
How it works
The script anchors its analysis to the most recent qualifying EP candle (a single-day move of 8%+ by default) and measures the stock's outperformance against a benchmark (default: NIFTYMIDSML400) since that candle — not over an arbitrary fixed window. This avoids one EP candle alone inflating a "strength" reading; the outperformance has to be sustained after the move, not just caused by it.
A setup requires four conditions together:
Outperformance vs benchmark since the EP candle exceeds a minimum threshold (default 10%)
Proximity to 52-week high (default within 20%) — confirming the stock hasn't lost its leadership
A qualifying EP candle within the detection window
A healthy pullback — price sitting inside the EMA9/EMA21 cloud (with a small tolerance for wick excursions) while the EMA9 > EMA21 > EMA50 stack stays intact, on below-average volume
When all four align, the script locks a breakout trigger price — the highest high since the EP candle — letting you pre-place a GTT order rather than waiting for a confirmed close above resistance, which is often a day or more late.
What it's good for
Catching stocks in the "coil after the jump" phase: violent move, quiet digestion, then continuation. It explicitly tracks how many separate EP candles have fired (visible as a diagnostic) so you can judge whether a stock had one clean catalyst or has been repeatedly volatile.
What it isn't built for
Slow, low-volatility grinders that never have a sharp EP candle (a different system altogether), and stocks that move too fast and too cleanly to ever pull back into the cloud on a daily timeframe.
Status
Actively used and refined against live market data — published as-is for traders who understand swing/momentum trading and want to incorporate systematic outperformance and pullback logic into their own process. Not financial advice; verify every signal against your own risk management before acting on it.
Açık kaynak kodlu komut dosyası
Gerçek TradingView ruhuyla, bu komut dosyasının mimarı, yatırımcıların işlevselliğini inceleyip doğrulayabilmesi için onu açık kaynaklı hale getirdi. Yazarı tebrik ederiz! Ücretsiz olarak kullanabilseniz de, kodu yeniden yayınlamanın Topluluk Kurallarımıza tabi olduğunu unutmayın.

Feragatname
Bilgiler ve yayınlar, TradingView tarafından sağlanan veya onaylanan finansal, yatırım, alım satım veya diğer türden tavsiye veya öneriler anlamına gelmez ve teşkil etmez. Kullanım Koşulları bölümünde daha fazlasını okuyun.
Açık kaynak kodlu komut dosyası
Gerçek TradingView ruhuyla, bu komut dosyasının mimarı, yatırımcıların işlevselliğini inceleyip doğrulayabilmesi için onu açık kaynaklı hale getirdi. Yazarı tebrik ederiz! Ücretsiz olarak kullanabilseniz de, kodu yeniden yayınlamanın Topluluk Kurallarımıza tabi olduğunu unutmayın.
Feragatname
Bilgiler ve yayınlar, TradingView tarafından sağlanan veya onaylanan finansal, yatırım, alım satım veya diğer türden tavsiye veya öneriler anlamına gelmez ve teşkil etmez. Kullanım Koşulları bölümünde daha fazlasını okuyun.