OPEN-SOURCE SCRIPT
True Strength Index Ribbon
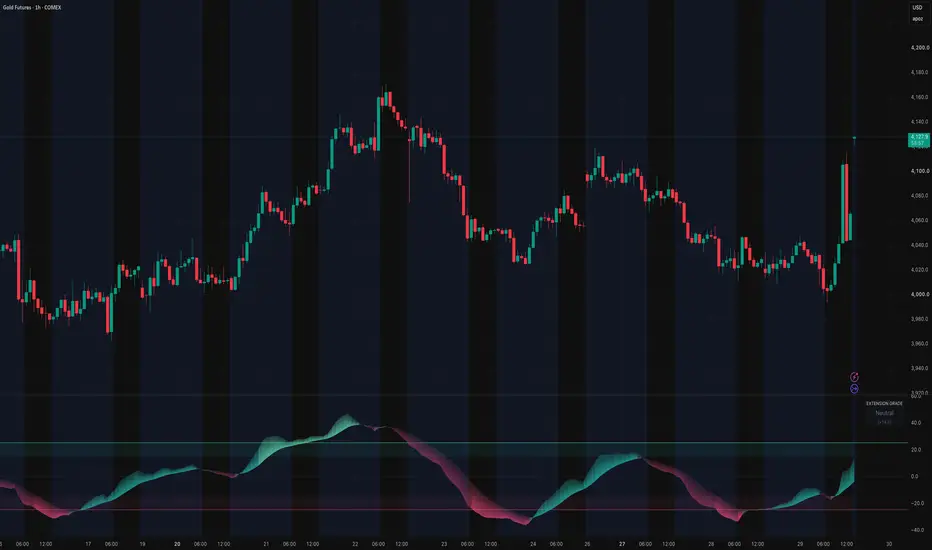
True Strength Index Ribbon: A new way to visualize momentum
Most TSI indicators answer a simple question:
"Is momentum bullish or bearish?"
The True Strength Index Gradient Ribbon was designed to answer a much more useful question:
"How committed is momentum to that direction?"
Instead of displaying two ordinary oscillator lines that constantly cross and overlap, this indicator transforms the relationship between the TSI and its signal line into a continuously expanding and contracting gradient ribbon.
The result is an oscillator that allows traders to recognize momentum shifts almost instantly while dramatically reducing the visual clutter common to traditional TSI implementations.
Why a ribbon?
Momentum isn't simply bullish or bearish.
- It has strength.
- It has conviction.
- It accelerates.
- It weakens.
- It compresses before expanding again.
The width of the ribbon naturally visualizes the distance between the TSI and its signal line.
A widening ribbon suggests increasing directional commitment.
A narrowing ribbon often indicates weakening momentum or an approaching transition.
Instead of mentally measuring the distance between two moving lines, your eyes recognize it immediately.
Designed for mean reversion and trend trading
While the indicator performs well as a traditional trend-following oscillator, it was specifically developed with mean reversion trading in mind.
Markets spend surprisingly little time at statistically stretched levels.
By combining directional momentum with configurable extension zones, traders can quickly identify when momentum is beginning to reverse after reaching unusually extended conditions.
The indicator intentionally avoids telling traders what to buy or sell.
Instead, it provides objective information that can be combined with price action, structure, moving averages, VWAP, volume, or any existing trading methodology.
Key Features
• Innovative gradient ribbon visualization
• Multiple signal moving average options:
- EMA
- SMA
- WMA
- RMA
- HMA
- VWMA
- ALMA
• Higher-timeframe smoothing without changing your chart timeframe
• Four display modes:
- Ribbon Only
- Signal Line Only
- Solid Signal Line Only
- Ribbon + Signal Line
• Customizable bullish, bearish, neutral, and extreme colors
• Configurable extension levels for progressively stretched market conditions
• Optional extension-zone shading
• Live Extension Grade panel showing:
- Direction
- Degree of extension
- Current TSI value
• Bullish and bearish crossover alerts
• Extension alerts for every major threshold
Timeframe smoothing
One of the more unique capabilities of this indicator is timeframe-based smoothing.
Instead of requiring traders to constantly switch chart timeframes, the script can internally scale its smoothing calculations to approximate the behavior of a higher timeframe while remaining on the current chart.
This produces cleaner momentum structure while preserving the convenience of lower-timeframe execution.
Extension Grades
Rather than treating all overbought and oversold conditions equally, this indicator classifies momentum into progressively stronger extension levels.
Examples include:
• Moderately Extended
• Extended
• Very Extended
• Extremely Extended
The goal isn't to predict reversals simply because a market reaches an extreme.
Instead, these classifications provide context so traders can better judge when momentum has become unusually stretched.
Built for customization
Every trader sees momentum differently.
Nearly every visual element can be customized, including:
- Colors
- Signal moving average
- Signal smoothing
- Ribbon visibility
- Timeframe smoothing
- Extension thresholds
- Zone shading
- Signal line appearance
This allows the indicator to adapt to different markets, different trading styles, and different visual preferences.
Design Philosophy
The best indicators don't make trading decisions.
They improve the trader's ability to understand market behavior.
The True Strength Index Ribbon was built around one simple objective:
Transform momentum from something you calculate...
into something you can immediately see.
If this script helps your trading, consider leaving a Like and sharing your feedback. Suggestions for future improvements are always welcome.
Disclaimer
This indicator is provided for educational and informational purposes only. It is designed to assist with market analysis and should not be considered financial or investment advice. No indicator can predict future market movements or guarantee profitable trades. Always conduct your own research, use appropriate risk management, and consider multiple factors before making any trading decisions.
Açık kaynak kodlu komut dosyası
Gerçek TradingView ruhuyla, bu komut dosyasının mimarı, yatırımcıların işlevselliğini inceleyip doğrulayabilmesi için onu açık kaynaklı hale getirdi. Yazarı tebrik ederiz! Ücretsiz olarak kullanabilseniz de, kodu yeniden yayınlamanın Topluluk Kurallarımıza tabi olduğunu unutmayın.

Feragatname
Bilgiler ve yayınlar, TradingView tarafından sağlanan veya onaylanan finansal, yatırım, alım satım veya diğer türden tavsiye veya öneriler anlamına gelmez ve teşkil etmez. Kullanım Koşulları bölümünde daha fazlasını okuyun.
Açık kaynak kodlu komut dosyası
Gerçek TradingView ruhuyla, bu komut dosyasının mimarı, yatırımcıların işlevselliğini inceleyip doğrulayabilmesi için onu açık kaynaklı hale getirdi. Yazarı tebrik ederiz! Ücretsiz olarak kullanabilseniz de, kodu yeniden yayınlamanın Topluluk Kurallarımıza tabi olduğunu unutmayın.
Feragatname
Bilgiler ve yayınlar, TradingView tarafından sağlanan veya onaylanan finansal, yatırım, alım satım veya diğer türden tavsiye veya öneriler anlamına gelmez ve teşkil etmez. Kullanım Koşulları bölümünde daha fazlasını okuyun.