OPEN-SOURCE SCRIPT
RSI with Zone Background Fill
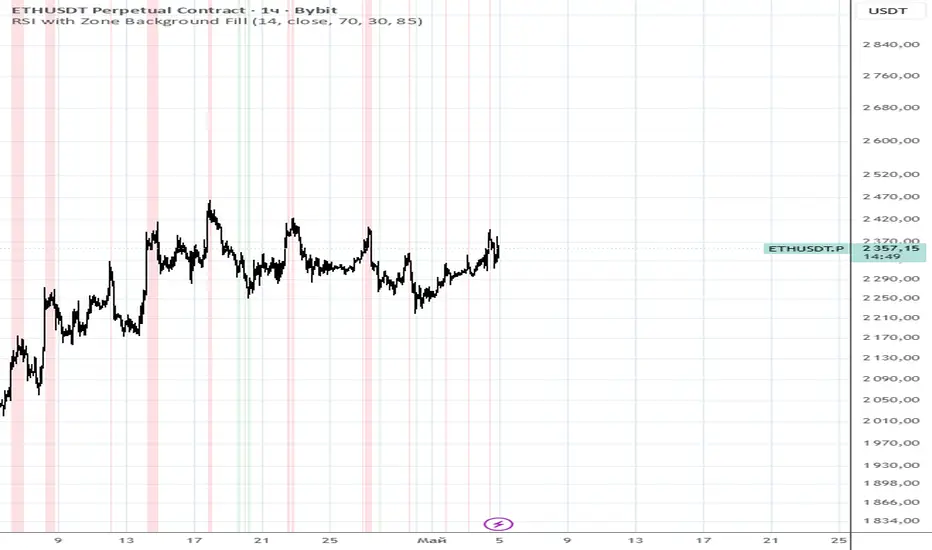
This indicator visually highlights overbought and oversold RSI zones directly on the price chart (since overlay=true).
What it does exactly:
Calculates the standard RSI (period 14, source close).
When RSI is above the specified level (default 70) — the chart background is colored reddish (overbought).
When RSI is below the specified level (default 30) — the background is colored greenish (oversold).
Fill transparency is adjustable (default 85% — barely noticeable).
The RSI line itself is not drawn on the chart (it is only displayed in the Data Window) to avoid cluttering the price chart.
Why it's useful:
To quickly see when the price is in extreme RSI zones without opening a separate indicator window. Convenient for context — for example, to look for reversals or confirm overbought/oversold conditions directly on the candles.https://prnt.sc/LvQLG-ft971R
Açık kaynak kodlu komut dosyası
Gerçek TradingView ruhuyla, bu komut dosyasının mimarı, yatırımcıların işlevselliğini inceleyip doğrulayabilmesi için onu açık kaynaklı hale getirdi. Yazarı tebrik ederiz! Ücretsiz olarak kullanabilseniz de, kodu yeniden yayınlamanın Topluluk Kurallarımıza tabi olduğunu unutmayın.

Feragatname
Bilgiler ve yayınlar, TradingView tarafından sağlanan veya onaylanan finansal, yatırım, alım satım veya diğer türden tavsiye veya öneriler anlamına gelmez ve teşkil etmez. Kullanım Koşulları bölümünde daha fazlasını okuyun.
Açık kaynak kodlu komut dosyası
Gerçek TradingView ruhuyla, bu komut dosyasının mimarı, yatırımcıların işlevselliğini inceleyip doğrulayabilmesi için onu açık kaynaklı hale getirdi. Yazarı tebrik ederiz! Ücretsiz olarak kullanabilseniz de, kodu yeniden yayınlamanın Topluluk Kurallarımıza tabi olduğunu unutmayın.
Feragatname
Bilgiler ve yayınlar, TradingView tarafından sağlanan veya onaylanan finansal, yatırım, alım satım veya diğer türden tavsiye veya öneriler anlamına gelmez ve teşkil etmez. Kullanım Koşulları bölümünde daha fazlasını okuyun.