OPEN-SOURCE SCRIPT
Developing FAB4 Zone
# Developing FAB4 Zone — Indicator Documentation
## Overview
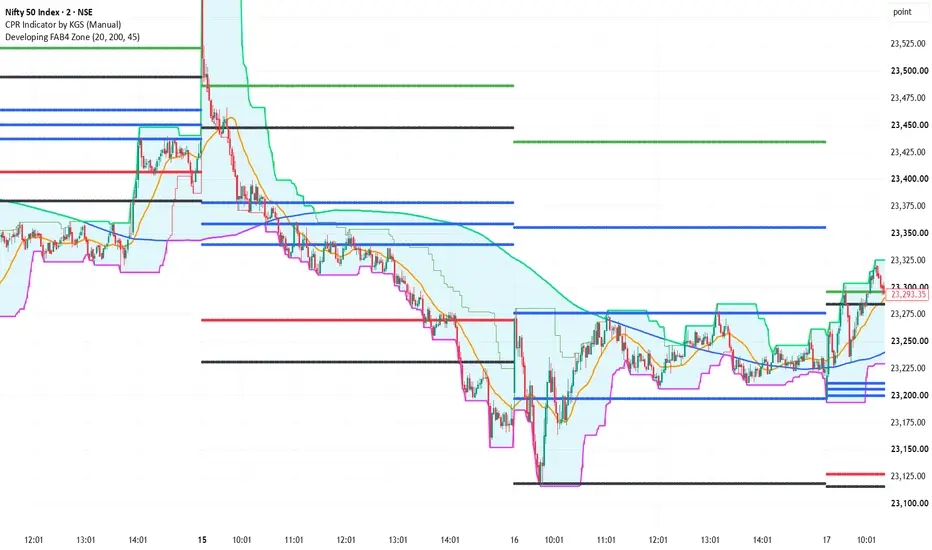
The Developing FAB4 Zone is a TradingView indicator designed to visualize a dynamic price zone using four key reference elements: the 20 SMA, 200 SMA, current day's closing price, and the high and low of the last 45 minutes.
## Calculation Logic
- **20 SMA:** Identifies the short-term trend.
- **200 SMA:** Provides a longer-term trend reference.
- **Current day's closing price:** Uses the latest available price/close during the ongoing session.
- **Last 45-minute high and low:** Tracks the highest and lowest prices over a rolling 45-minute window. On a 2-minute chart, this uses 23 candles (approximately 46 minutes).
## Zone Formation
- **Zone High:** The highest value among the 20 SMA, 200 SMA, current price, and rolling 45-minute high.
- **Zone Low:** The lowest value among the 20 SMA, 200 SMA, current price, and rolling 45-minute low.
The zone updates as market conditions change, allowing traders to observe shifts in price structure and key reference levels.
## Intended Use
The indicator is intended to help traders visualize dynamic support and resistance areas, monitor price relative to moving averages, and identify potential breakout or rejection zones.
**Note:** This is a custom interpretation of the FAB4 concept, not a verified reproduction of Oliver Velez's exact trading rules. The indicator provides visual reference levels and does not independently generate trade signals.
## Overview
The Developing FAB4 Zone is a TradingView indicator designed to visualize a dynamic price zone using four key reference elements: the 20 SMA, 200 SMA, current day's closing price, and the high and low of the last 45 minutes.
## Calculation Logic
- **20 SMA:** Identifies the short-term trend.
- **200 SMA:** Provides a longer-term trend reference.
- **Current day's closing price:** Uses the latest available price/close during the ongoing session.
- **Last 45-minute high and low:** Tracks the highest and lowest prices over a rolling 45-minute window. On a 2-minute chart, this uses 23 candles (approximately 46 minutes).
## Zone Formation
- **Zone High:** The highest value among the 20 SMA, 200 SMA, current price, and rolling 45-minute high.
- **Zone Low:** The lowest value among the 20 SMA, 200 SMA, current price, and rolling 45-minute low.
The zone updates as market conditions change, allowing traders to observe shifts in price structure and key reference levels.
## Intended Use
The indicator is intended to help traders visualize dynamic support and resistance areas, monitor price relative to moving averages, and identify potential breakout or rejection zones.
**Note:** This is a custom interpretation of the FAB4 concept, not a verified reproduction of Oliver Velez's exact trading rules. The indicator provides visual reference levels and does not independently generate trade signals.
Açık kaynak kodlu komut dosyası
Gerçek TradingView ruhuyla, bu komut dosyasının mimarı, yatırımcıların işlevselliğini inceleyip doğrulayabilmesi için onu açık kaynaklı hale getirdi. Yazarı tebrik ederiz! Ücretsiz olarak kullanabilseniz de, kodu yeniden yayınlamanın Topluluk Kurallarımıza tabi olduğunu unutmayın.

Feragatname
Bilgiler ve yayınlar, TradingView tarafından sağlanan veya onaylanan finansal, yatırım, alım satım veya diğer türden tavsiye veya öneriler anlamına gelmez ve teşkil etmez. Kullanım Koşulları bölümünde daha fazlasını okuyun.
Açık kaynak kodlu komut dosyası
Gerçek TradingView ruhuyla, bu komut dosyasının mimarı, yatırımcıların işlevselliğini inceleyip doğrulayabilmesi için onu açık kaynaklı hale getirdi. Yazarı tebrik ederiz! Ücretsiz olarak kullanabilseniz de, kodu yeniden yayınlamanın Topluluk Kurallarımıza tabi olduğunu unutmayın.
Feragatname
Bilgiler ve yayınlar, TradingView tarafından sağlanan veya onaylanan finansal, yatırım, alım satım veya diğer türden tavsiye veya öneriler anlamına gelmez ve teşkil etmez. Kullanım Koşulları bölümünde daha fazlasını okuyun.