DCA vs Market Timing vs ATH Buying - Backtesting
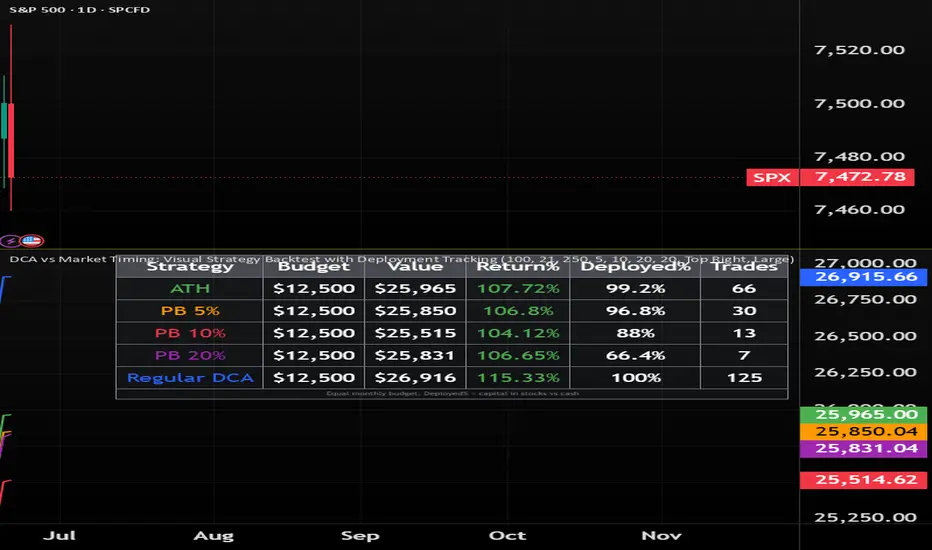
Compare investment timing strategies with equal capital to see which actually performs best.
This indicator backtests whether buying at all-time highs, waiting for pullbacks, or regular DCA builds more wealth over time.
Each strategy receives the same monthly budget (default $100). The difference is when they invest:
Key Metrics:
The Deployed% column reveals the hidden cost of waiting. Pullback strategies often underperform because they keep too much cash idle, missing the gains that occur while waiting for corrections.
Use Cases:
This indicator backtests whether buying at all-time highs, waiting for pullbacks, or regular DCA builds more wealth over time.
Each strategy receives the same monthly budget (default $100). The difference is when they invest:
- ATH Strategy: Invests when price hits new highs (1-year lookback default)
- Pullback Strategies: Wait for 5%, 10%, 15%, or 20% corrections before investing
- Regular DCA: Invests monthly regardless of price
Key Metrics:
- Budget: Total capital allocated (equal for all)
- Value: Current portfolio value (stocks + cash)
- Return%: Overall performance
- Deployed%: How much capital is actually invested vs sitting in cash earning 0%
- Trades: Number of investments made
The Deployed% column reveals the hidden cost of waiting. Pullback strategies often underperform because they keep too much cash idle, missing the gains that occur while waiting for corrections.
Use Cases:
- Validate whether waiting for corrections is worth the opportunity cost
- Test different pullback thresholds on historical data
- Compare ATH investing vs DCA vs market timing
- Analyze performance across different time periods
- Results typically show that time in the market beats timing the market—this tool lets you prove it with data.

Hedge Fund Manager | Wealth Educator | 20+ yrs investing | Stocks, ETFs & Crypto alerts | Join Henrique Wealth Academy for trade alerts & indicators → skool.com/be-limitless/
Feragatname
Bilgiler ve yayınlar, TradingView tarafından sağlanan veya onaylanan finansal, yatırım, alım satım veya diğer türden tavsiye veya öneriler anlamına gelmez ve teşkil etmez. Kullanım Koşulları bölümünde daha fazlasını okuyun.
Hedge Fund Manager | Wealth Educator | 20+ yrs investing | Stocks, ETFs & Crypto alerts | Join Henrique Wealth Academy for trade alerts & indicators → skool.com/be-limitless/
Feragatname
Bilgiler ve yayınlar, TradingView tarafından sağlanan veya onaylanan finansal, yatırım, alım satım veya diğer türden tavsiye veya öneriler anlamına gelmez ve teşkil etmez. Kullanım Koşulları bölümünde daha fazlasını okuyun.