OPEN-SOURCE SCRIPT
Visual Trading Zones
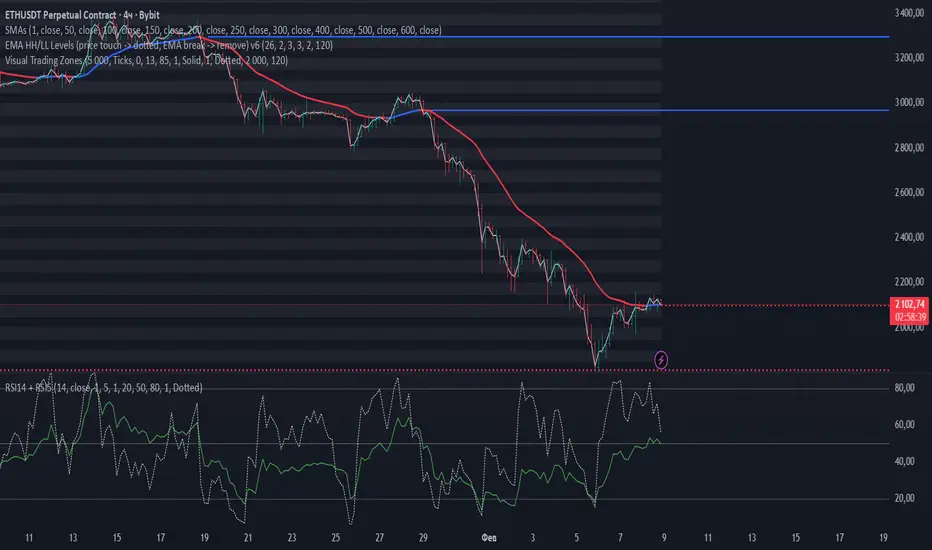
Visual Trading Zones is a chart-based indicator designed to display clear and structured price zones using evenly spaced levels.
The indicator automatically builds horizontal zones across the visible price range and helps traders visually identify potential areas of interest such as support, resistance, and reaction zones.
Key Features
Displays horizontal price zones with a fixed step
Optional main levels and sub-levels inside each zone
Clean and minimal visual presentation
Works on any market and timeframe
Fully customizable colors, line styles, and zone transparency
No signals, no alerts — purely visual analysis tool
How It Works
Price zones are constructed using a user-defined step size.
Each zone is visually highlighted, allowing traders to quickly see how price interacts with these areas over time.
The indicator does not repaint and does not generate trading signals.
It is intended to be used as a visual framework alongside any trading strategy.
Recommended Use
Identifying potential support and resistance zones
Market structure and range analysis
Confluence with price action, indicators, or volume tools
⚙️ Settings Overview
Step — distance between price zones
Step Unit — ticks or pips (for FX instruments)
SubLevels — number of internal levels within each zone
Show Zones / Lines / Prices — visual display options
Range Bars — number of bars used to build zones
Style Settings — colors, line styles, transparency
The indicator automatically builds horizontal zones across the visible price range and helps traders visually identify potential areas of interest such as support, resistance, and reaction zones.
Key Features
Displays horizontal price zones with a fixed step
Optional main levels and sub-levels inside each zone
Clean and minimal visual presentation
Works on any market and timeframe
Fully customizable colors, line styles, and zone transparency
No signals, no alerts — purely visual analysis tool
How It Works
Price zones are constructed using a user-defined step size.
Each zone is visually highlighted, allowing traders to quickly see how price interacts with these areas over time.
The indicator does not repaint and does not generate trading signals.
It is intended to be used as a visual framework alongside any trading strategy.
Recommended Use
Identifying potential support and resistance zones
Market structure and range analysis
Confluence with price action, indicators, or volume tools
⚙️ Settings Overview
Step — distance between price zones
Step Unit — ticks or pips (for FX instruments)
SubLevels — number of internal levels within each zone
Show Zones / Lines / Prices — visual display options
Range Bars — number of bars used to build zones
Style Settings — colors, line styles, transparency
Açık kaynak kodlu komut dosyası
Gerçek TradingView ruhuyla, bu komut dosyasının mimarı, yatırımcıların işlevselliğini inceleyip doğrulayabilmesi için onu açık kaynaklı hale getirdi. Yazarı tebrik ederiz! Ücretsiz olarak kullanabilseniz de, kodu yeniden yayınlamanın Topluluk Kurallarımıza tabi olduğunu unutmayın.

Feragatname
Bilgiler ve yayınlar, TradingView tarafından sağlanan veya onaylanan finansal, yatırım, alım satım veya diğer türden tavsiye veya öneriler anlamına gelmez ve teşkil etmez. Kullanım Koşulları bölümünde daha fazlasını okuyun.
Açık kaynak kodlu komut dosyası
Gerçek TradingView ruhuyla, bu komut dosyasının mimarı, yatırımcıların işlevselliğini inceleyip doğrulayabilmesi için onu açık kaynaklı hale getirdi. Yazarı tebrik ederiz! Ücretsiz olarak kullanabilseniz de, kodu yeniden yayınlamanın Topluluk Kurallarımıza tabi olduğunu unutmayın.
Feragatname
Bilgiler ve yayınlar, TradingView tarafından sağlanan veya onaylanan finansal, yatırım, alım satım veya diğer türden tavsiye veya öneriler anlamına gelmez ve teşkil etmez. Kullanım Koşulları bölümünde daha fazlasını okuyun.