OPEN-SOURCE SCRIPT
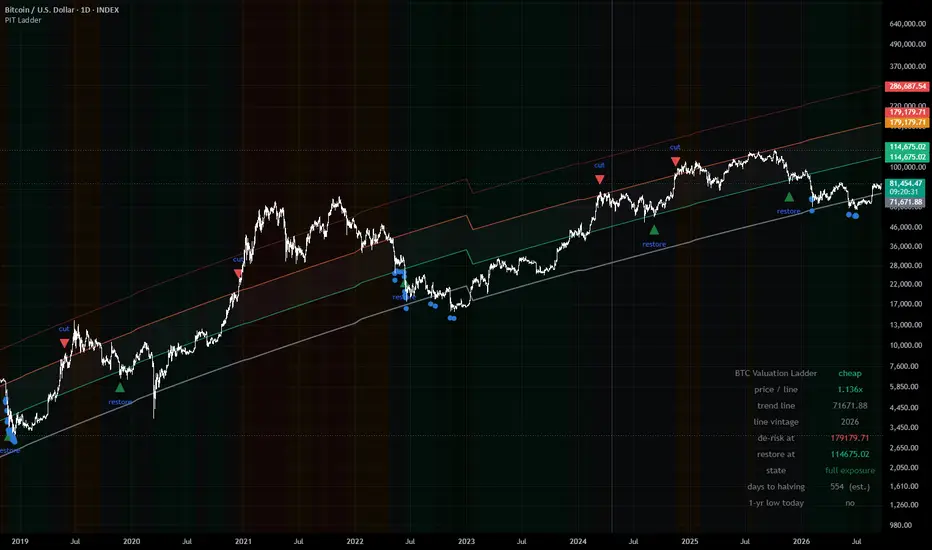
BTC Power-Law Ladder (Point-in-Time)
WHAT IT DOES
Divides Bitcoin's daily close by a power-law trend line fitted to the lower edge
of its own price history, then sorts the result into five labelled rungs. The
reading answers one question: how far is price stretched above the floor that
has historically held it?
This is a risk-framing tool. It is not an entry signal and it is not advice.
THE TREND LINE
line(d) = 10^a * d^b d = days since the genesis block, 2009-01-03
The coefficients come from a quantile regression through the 1% lower quantile
of log price against log days — a line that tracks the bottom edge of the
distribution rather than its middle.
What makes this version different: the line is refit every January, and each
year is drawn with the coefficients that were available in that year. The 2016
fit uses only data through 2015-12-31. The 2020 fit uses only data through
2019-12-31. Thirteen vintages are stored, 2014 through 2026. Nothing on the
chart was fitted on the history it is being drawn over.
Most published power-law charts use a single set of constants fitted across the
entire history, then plot them back over that same history. Those charts show
you a line that knew how every cycle ended. This one does not.
Because a hard coefficient switch on January 1 would move the line — and
therefore the ratio — overnight with no price action behind it, each new vintage
is phased in over the first 21 bars of the year (adjustable). Both fits are
known on January 1, so the blend introduces no future information. The 2016
vintage sits 43% below the 2015 vintage; without the blend that single step
would jump the ratio by 77% and could trip a rung change on its own.
THE RUNGS
Fixed at 1.0x, 1.6x, 2.5x and 4.0x. These boundaries do not move when you change
the de-risk settings, because the statistics below were measured at these
specific values.
What followed each rung, 2014-01-01 to 2026-09-16 (4,642 daily closes, medians):
rung days 2-yr median positive next-yr drawdown P(dd < -50%)
below 1.0 445 9.77x 100% -30% 0%
1.0 - 1.6 1,544 4.31x 100% -30% 14%
1.6 - 2.5 1,162 2.05x 89% -49% 46%
2.5 - 4.0 764 1.60x 76% -62% 90%
above 4.0 727 0.74x 28% -72% 97%
Read the day counts as overlapping windows, not as independent observations. The
ratio's one-day autocorrelation is 0.997, so consecutive days in the same rung
are very nearly the same observation counted again.
THE DE-RISK STATE MACHINE
Optional markers for a hysteresis rule: reduce exposure when the ratio closes
above 2.5, restore when it closes below 1.6. The band between the two levels
prevents the state from flipping on noise. The machine only evaluates confirmed
closes, so what you see on the chart is what the rule would have done, not what
an intrabar wick briefly suggested.
Over the same window, with costs and exposure lagged one day:
buy and hold Sharpe 0.88 max drawdown -83.6% 101x
the rule Sharpe 1.16 max drawdown -55.9% 260x 6 round trips
Tested against 5,000 random vetoes of the same six durations at random dates:
p = 0.0022 (Sharpe), 0.0006 (drawdown), 0.0142 (terminal multiple).
WHAT THIS IS NOT — READ THIS PART
Six completed round trips is far below any reasonable evidence threshold. My assessment of this rule is "insufficient evidence — tracked, not
rejected." It is not a validated edge, and it is presented here as a framework
for thinking about risk, not as a system to trade.
One specific failure: the 2017 episode alone accounts for 57.9% of the rule's
entire gross profit. It also gave up a 67.6% rally between the cut at $2,258 and
the restore at $3,783. A track record resting on one event is a track record you
do not yet understand.
The threshold grid used for robustness testing is not independent evidence.
Adjacent thresholds fire within days of each other on a signal with 0.997
autocorrelation, so a cut at 2.4 and a cut at 2.6 trade the same six episodes.
The grid shows the result is not balanced on a knife edge; it does not multiply
the evidence.
The point-in-time refits remove coefficient hindsight, not specification
hindsight. The 2014 coefficients use only pre-2014 data — but the decision to
fit a power law to the 1% lower quantile of log-log Bitcoin history was made by
people who had already seen that history. That choice was not available in 2014.
Coefficients for 2027 and later fall back to the most recent fit and are flagged
"provisional" in the readout table. They will be replaced as new vintages become
available.
SETTINGS
Line — Real-time (the point-in-time vintages, default, starts 2014), Published
constants (the widely-quoted full-history fit, for comparison), or Custom.
January blend length — bars over which a new vintage phases in. Default 21. Set
to 1 for a hard switch.
De-risk above / Restore below — the operative rule levels. Moving them off
2.5 / 1.6 takes the rule off the tested configuration; the readout table flags
this. The rung boundaries stay fixed regardless.
Markers — rung tint, boundary lines, de-risk and restore triangles, trailing
one-year lows, halving shading, and a readout table (four corner positions).
Five alert conditions are available: crossing the de-risk level, crossing the
restore level, losing the trend line, reclaiming it, and a new trailing
one-year low.
REQUIREMENTS
Bitcoin, daily timeframe, log price scale. The trend line is defined on days
since the genesis block and is not meaningful on other timeframes or symbols;
the script will tell you so rather than silently drawing nothing.
DISCLAIMER
This indicator is a research and risk-framing tool. It is not financial advice,
not a recommendation to buy or sell any asset, and not a trading system.
Every statistic shown describes what has already happened across a single asset
over roughly twelve years containing four market cycles. Bitcoin's history is
short, its regime has changed repeatedly, and nothing about the past behaviour of
this ratio guarantees or implies anything about its future behaviour. A power-law
floor holds until it does not, and there is no mechanism that obliges it to hold
at all.
The de-risk rule shown here is explicitly rated as having insufficient evidence
by its own author. It is published so that its logic and its weaknesses are both
visible, not because it has been demonstrated to work.
Trading digital assets involves substantial risk of loss. You are responsible for
your own decisions and should consult a qualified professional regarding your
particular circumstances.
Divides Bitcoin's daily close by a power-law trend line fitted to the lower edge
of its own price history, then sorts the result into five labelled rungs. The
reading answers one question: how far is price stretched above the floor that
has historically held it?
This is a risk-framing tool. It is not an entry signal and it is not advice.
THE TREND LINE
line(d) = 10^a * d^b d = days since the genesis block, 2009-01-03
The coefficients come from a quantile regression through the 1% lower quantile
of log price against log days — a line that tracks the bottom edge of the
distribution rather than its middle.
What makes this version different: the line is refit every January, and each
year is drawn with the coefficients that were available in that year. The 2016
fit uses only data through 2015-12-31. The 2020 fit uses only data through
2019-12-31. Thirteen vintages are stored, 2014 through 2026. Nothing on the
chart was fitted on the history it is being drawn over.
Most published power-law charts use a single set of constants fitted across the
entire history, then plot them back over that same history. Those charts show
you a line that knew how every cycle ended. This one does not.
Because a hard coefficient switch on January 1 would move the line — and
therefore the ratio — overnight with no price action behind it, each new vintage
is phased in over the first 21 bars of the year (adjustable). Both fits are
known on January 1, so the blend introduces no future information. The 2016
vintage sits 43% below the 2015 vintage; without the blend that single step
would jump the ratio by 77% and could trip a rung change on its own.
THE RUNGS
Fixed at 1.0x, 1.6x, 2.5x and 4.0x. These boundaries do not move when you change
the de-risk settings, because the statistics below were measured at these
specific values.
What followed each rung, 2014-01-01 to 2026-09-16 (4,642 daily closes, medians):
rung days 2-yr median positive next-yr drawdown P(dd < -50%)
below 1.0 445 9.77x 100% -30% 0%
1.0 - 1.6 1,544 4.31x 100% -30% 14%
1.6 - 2.5 1,162 2.05x 89% -49% 46%
2.5 - 4.0 764 1.60x 76% -62% 90%
above 4.0 727 0.74x 28% -72% 97%
Read the day counts as overlapping windows, not as independent observations. The
ratio's one-day autocorrelation is 0.997, so consecutive days in the same rung
are very nearly the same observation counted again.
THE DE-RISK STATE MACHINE
Optional markers for a hysteresis rule: reduce exposure when the ratio closes
above 2.5, restore when it closes below 1.6. The band between the two levels
prevents the state from flipping on noise. The machine only evaluates confirmed
closes, so what you see on the chart is what the rule would have done, not what
an intrabar wick briefly suggested.
Over the same window, with costs and exposure lagged one day:
buy and hold Sharpe 0.88 max drawdown -83.6% 101x
the rule Sharpe 1.16 max drawdown -55.9% 260x 6 round trips
Tested against 5,000 random vetoes of the same six durations at random dates:
p = 0.0022 (Sharpe), 0.0006 (drawdown), 0.0142 (terminal multiple).
WHAT THIS IS NOT — READ THIS PART
Six completed round trips is far below any reasonable evidence threshold. My assessment of this rule is "insufficient evidence — tracked, not
rejected." It is not a validated edge, and it is presented here as a framework
for thinking about risk, not as a system to trade.
One specific failure: the 2017 episode alone accounts for 57.9% of the rule's
entire gross profit. It also gave up a 67.6% rally between the cut at $2,258 and
the restore at $3,783. A track record resting on one event is a track record you
do not yet understand.
The threshold grid used for robustness testing is not independent evidence.
Adjacent thresholds fire within days of each other on a signal with 0.997
autocorrelation, so a cut at 2.4 and a cut at 2.6 trade the same six episodes.
The grid shows the result is not balanced on a knife edge; it does not multiply
the evidence.
The point-in-time refits remove coefficient hindsight, not specification
hindsight. The 2014 coefficients use only pre-2014 data — but the decision to
fit a power law to the 1% lower quantile of log-log Bitcoin history was made by
people who had already seen that history. That choice was not available in 2014.
Coefficients for 2027 and later fall back to the most recent fit and are flagged
"provisional" in the readout table. They will be replaced as new vintages become
available.
SETTINGS
Line — Real-time (the point-in-time vintages, default, starts 2014), Published
constants (the widely-quoted full-history fit, for comparison), or Custom.
January blend length — bars over which a new vintage phases in. Default 21. Set
to 1 for a hard switch.
De-risk above / Restore below — the operative rule levels. Moving them off
2.5 / 1.6 takes the rule off the tested configuration; the readout table flags
this. The rung boundaries stay fixed regardless.
Markers — rung tint, boundary lines, de-risk and restore triangles, trailing
one-year lows, halving shading, and a readout table (four corner positions).
Five alert conditions are available: crossing the de-risk level, crossing the
restore level, losing the trend line, reclaiming it, and a new trailing
one-year low.
REQUIREMENTS
Bitcoin, daily timeframe, log price scale. The trend line is defined on days
since the genesis block and is not meaningful on other timeframes or symbols;
the script will tell you so rather than silently drawing nothing.
DISCLAIMER
This indicator is a research and risk-framing tool. It is not financial advice,
not a recommendation to buy or sell any asset, and not a trading system.
Every statistic shown describes what has already happened across a single asset
over roughly twelve years containing four market cycles. Bitcoin's history is
short, its regime has changed repeatedly, and nothing about the past behaviour of
this ratio guarantees or implies anything about its future behaviour. A power-law
floor holds until it does not, and there is no mechanism that obliges it to hold
at all.
The de-risk rule shown here is explicitly rated as having insufficient evidence
by its own author. It is published so that its logic and its weaknesses are both
visible, not because it has been demonstrated to work.
Trading digital assets involves substantial risk of loss. You are responsible for
your own decisions and should consult a qualified professional regarding your
particular circumstances.
Açık kaynak kodlu komut dosyası
Gerçek TradingView ruhuyla, bu komut dosyasının mimarı, yatırımcıların işlevselliğini inceleyip doğrulayabilmesi için onu açık kaynaklı hale getirdi. Yazarı tebrik ederiz! Ücretsiz olarak kullanabilseniz de, kodu yeniden yayınlamanın Topluluk Kurallarımıza tabi olduğunu unutmayın.

Feragatname
Bilgiler ve yayınlar, TradingView tarafından sağlanan veya onaylanan finansal, yatırım, alım satım veya diğer türden tavsiye veya öneriler anlamına gelmez ve teşkil etmez. Kullanım Koşulları bölümünde daha fazlasını okuyun.
Açık kaynak kodlu komut dosyası
Gerçek TradingView ruhuyla, bu komut dosyasının mimarı, yatırımcıların işlevselliğini inceleyip doğrulayabilmesi için onu açık kaynaklı hale getirdi. Yazarı tebrik ederiz! Ücretsiz olarak kullanabilseniz de, kodu yeniden yayınlamanın Topluluk Kurallarımıza tabi olduğunu unutmayın.
Feragatname
Bilgiler ve yayınlar, TradingView tarafından sağlanan veya onaylanan finansal, yatırım, alım satım veya diğer türden tavsiye veya öneriler anlamına gelmez ve teşkil etmez. Kullanım Koşulları bölümünde daha fazlasını okuyun.