OPEN-SOURCE SCRIPT
Güncellendi Multiple MA Dashboard [PUCHON]
📊 Multiple MA Dashboard [PUCHON]
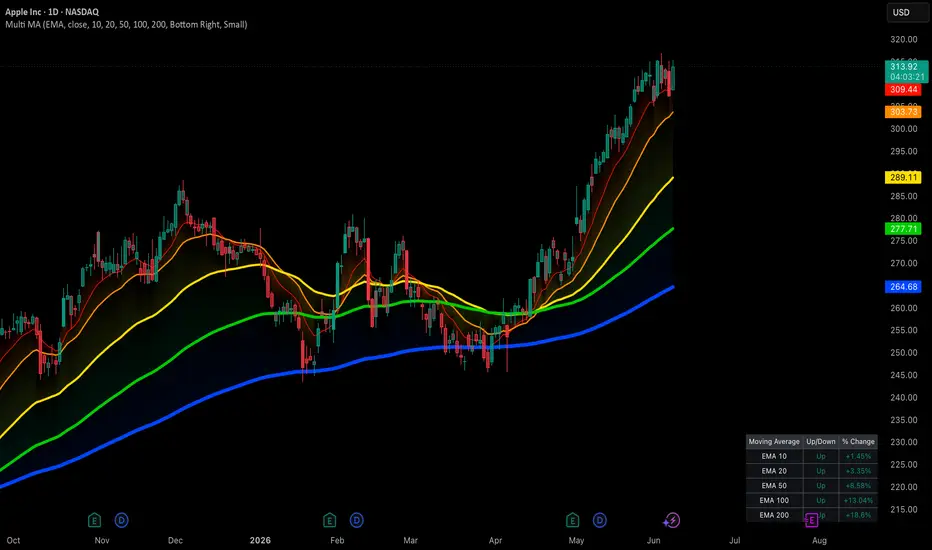
The Multiple MA Dashboard plots up to 5 moving averages of a chosen type (EMA, SMA, WMA, or RMA) directly on your chart and summarizes their relationship to price in a clean, real-time table. Instead of eyeballing where price sits relative to each average, this indicator gives you an instant Up/Down read and the exact percentage distance for every MA.
✨ Features:
- 📈 5 Configurable Moving Averages: Set independent lengths (defaults: 10, 20, 50, 100, 200) sharing one MA type and source.
- 🔁 Switchable MA Type: Choose between EMA, SMA, WMA, and RMA from a single dropdown — all 5 lines update together.
- 📋 Live Dashboard Table: Displays each MA's label, trend direction (Up/Down), and percentage distance from price, refreshed on the latest bar.
- 🎨 Dynamic Trend Coloring: Lines, fills, and table text automatically switch between your chosen "Up" and "Down" colors based on whether price is above or below each MA.
- 🌈 Price-to-MA Fill Zones: Shaded regions between price and each MA make the gap easy to see at a glance.
- ⚙️ Fully Customizable: Adjust MA lengths, source, dashboard position, text size, and theme colors to fit your setup.
🧮 Calculation Logic:
The core getMa function selects the moving average algorithm based on the user's choice, while each MA's color and table row are derived from a simple comparison between price and that MA.
Pine Script®
💡 Interpretation:
- 🟢 Up (price > MA): Price is trading above the average — shown in your "Up Trend" color with a positive % distance.
- 🔴 Down (price < MA): Price is trading below the average — shown in your "Down Trend" color with a negative % distance.
- 📏 % Change: The percentage gap between price and each MA, useful for gauging how stretched or compressed price is relative to that average.
⚠️ Disclaimer:
This tool is provided for educational and informational purposes only. It does not constitute financial advice and does not guarantee future performance. Always combine it with your own analysis and proper risk management.
The Multiple MA Dashboard plots up to 5 moving averages of a chosen type (EMA, SMA, WMA, or RMA) directly on your chart and summarizes their relationship to price in a clean, real-time table. Instead of eyeballing where price sits relative to each average, this indicator gives you an instant Up/Down read and the exact percentage distance for every MA.
✨ Features:
- 📈 5 Configurable Moving Averages: Set independent lengths (defaults: 10, 20, 50, 100, 200) sharing one MA type and source.
- 🔁 Switchable MA Type: Choose between EMA, SMA, WMA, and RMA from a single dropdown — all 5 lines update together.
- 📋 Live Dashboard Table: Displays each MA's label, trend direction (Up/Down), and percentage distance from price, refreshed on the latest bar.
- 🎨 Dynamic Trend Coloring: Lines, fills, and table text automatically switch between your chosen "Up" and "Down" colors based on whether price is above or below each MA.
- 🌈 Price-to-MA Fill Zones: Shaded regions between price and each MA make the gap easy to see at a glance.
- ⚙️ Fully Customizable: Adjust MA lengths, source, dashboard position, text size, and theme colors to fit your setup.
🧮 Calculation Logic:
The core getMa function selects the moving average algorithm based on the user's choice, while each MA's color and table row are derived from a simple comparison between price and that MA.
💡 Interpretation:
- 🟢 Up (price > MA): Price is trading above the average — shown in your "Up Trend" color with a positive % distance.
- 🔴 Down (price < MA): Price is trading below the average — shown in your "Down Trend" color with a negative % distance.
- 📏 % Change: The percentage gap between price and each MA, useful for gauging how stretched or compressed price is relative to that average.
⚠️ Disclaimer:
This tool is provided for educational and informational purposes only. It does not constitute financial advice and does not guarantee future performance. Always combine it with your own analysis and proper risk management.
Sürüm Notları
Updated: Able to adjust color on MASürüm Notları
Fixed: NameAçık kaynak kodlu komut dosyası
Gerçek TradingView ruhuyla, bu komut dosyasının mimarı, yatırımcıların işlevselliğini inceleyip doğrulayabilmesi için onu açık kaynaklı hale getirdi. Yazarı tebrik ederiz! Ücretsiz olarak kullanabilseniz de, kodu yeniden yayınlamanın Topluluk Kurallarımıza tabi olduğunu unutmayın.

Feragatname
Bilgiler ve yayınlar, TradingView tarafından sağlanan veya onaylanan finansal, yatırım, alım satım veya diğer türden tavsiye veya öneriler anlamına gelmez ve teşkil etmez. Kullanım Koşulları bölümünde daha fazlasını okuyun.
Açık kaynak kodlu komut dosyası
Gerçek TradingView ruhuyla, bu komut dosyasının mimarı, yatırımcıların işlevselliğini inceleyip doğrulayabilmesi için onu açık kaynaklı hale getirdi. Yazarı tebrik ederiz! Ücretsiz olarak kullanabilseniz de, kodu yeniden yayınlamanın Topluluk Kurallarımıza tabi olduğunu unutmayın.
Feragatname
Bilgiler ve yayınlar, TradingView tarafından sağlanan veya onaylanan finansal, yatırım, alım satım veya diğer türden tavsiye veya öneriler anlamına gelmez ve teşkil etmez. Kullanım Koşulları bölümünde daha fazlasını okuyun.