Staged Exit Planner
█ OVERVIEW
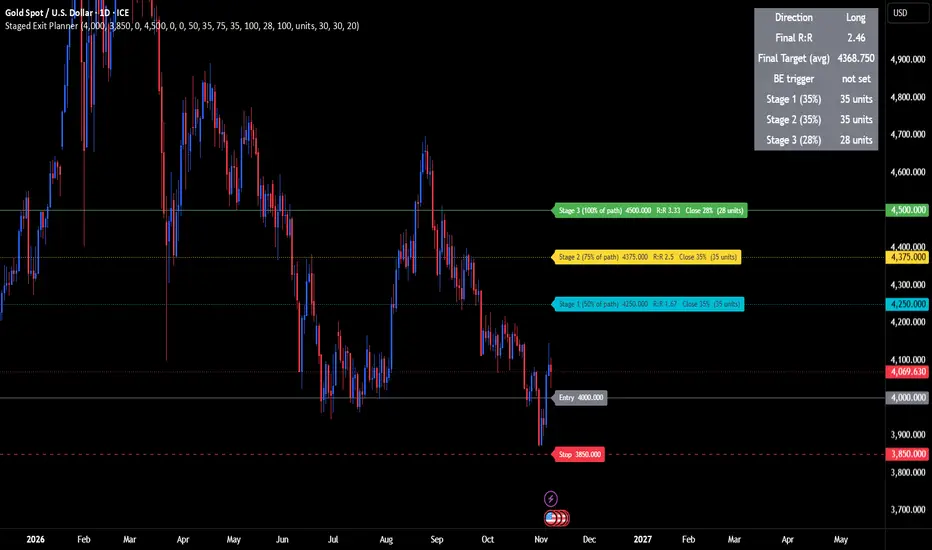
Staged Exit Planner is a trade-planning tool: you enter a trade you have already decided on, and it draws every level on your chart, splits the position into partial exits and calculates the resulting risk-to-reward.
You provide an entry price, a stop-loss price, up to three targets and a position size. The script then shows:
• Horizontal lines for the entry, the stop-loss, an optional breakeven trigger and every exit level.
• A label on each exit level with its price, its R:R (the reward measured in multiples of your risk) and how much of the position to close there.
• The exact prices as colored tags on the right-hand price axis.
• A summary table with the trade direction, the Final R:R of the whole plan and the Final Target, which is the volume-weighted average exit price.
The focus is on what happens when you take profit in stages instead of at a single target. Every partial exit changes both the blended average exit price and the overall R:R, and this tool calculates both for you.
Exits can be staged in two ways. In Manual-Target mode each stage has its own target price. In Single-Target % of Path mode all stages sit at percentages of the distance between the entry and Target 1. Both modes are explained in detail below.
What it is not: it does not find entries, generate signals, place orders, send alerts or track whether price has reached a level. Every number comes from the values you type in. It works on any symbol and timeframe, and it detects Long or Short automatically from where your stop-loss sits relative to your entry.
█ QUICK START
Five steps take you from an empty chart to a complete exit plan.
1. Add the script to your chart and open its settings (Inputs tab). The inputs are grouped in the same order as the sections below.
2. In "Trade levels", type your Entry price and your Stop-loss price. If the stop is below the entry the trade is a Long, if it is above the entry the trade is a Short. Until both prices are valid, the table in the top-right corner shows "Set entry / stop-loss in the settings above".
3. In "Position size", type the size of your position in any unit you like (lots, contracts, coins, shares). Optionally type that unit's name in "Size unit label" so it appears next to every volume.
4. Choose how to stage your exits:
◦ Manual-Target mode (default): in "Targets", enable Target 1 and type its price, and do the same for Targets 2 and 3 if you use them. Then, in "Staged exit plan (manual-target mode)", enable the stages you want and set the % of the position closed at each one.
◦ Single-Target % of Path mode: in "Single-target % -of-path staging", switch on "Enable". Then, in "Targets", enable Target 1 and type its price. All three stages are now active automatically; set where each one sits on the path to Target 1 and how much volume it closes.
5. Optional: type a "Breakeven trigger price" to draw a reminder line for the price where you plan to move your stop to breakeven.
The lines, labels, price-axis tags and the summary table update instantly every time you change a setting.
In both modes Target 1 must be enabled and have a valid price. Without it, no exit level can be drawn.
█ SETTINGS REFERENCE
Every input is listed below in the order it appears in the settings, with its default value.
Trade levels
• Entry price (default 0): the price where you entered, or plan to enter, the trade. It must not be 0.
• Stop-loss price (default 0): the price where the trade is abandoned. It must not be 0 and must differ from the entry. Its position relative to the entry sets the direction: stop below entry = Long, stop above entry = Short.
• Breakeven trigger price (default 0, which hides the line): the price where you plan to move your stop to your entry price. It is drawn as a reminder line labeled "BE trigger -> move stop to" followed by your entry price. It is not used in any calculation and the script does not check which side of the entry you put it on. Place it beyond the entry in the profit direction: above the entry for a Long, below the entry for a Short.
Targets
• Enable Target 1 / 2 / 3 (default off) and Target 1 / 2 / 3 price (default 0): the exit levels used in Manual-Target mode. A target is used only if it is enabled, its price is not 0 and it lies on the profit side of the entry (above it for a Long, below it for a Short). A target that fails any of these conditions is silently ignored: it is not drawn and not counted.
Single-target % -of-path staging
• Enable (default off): switches on Single-Target % of Path mode. While it is on, Targets 2 and 3, the "Enable stage" switches and the "% closed" fields of the manual-target group are ignored.
• Stage 1 / 2 / 3: % of path to Target 1 (defaults 50, 75, 100; range 0 to 100): where each stage sits between the entry (0%) and Target 1 (100%).
• Stage 1 / 2 / 3: % of volume to close (defaults 20, 30, 20; range 0 to 100): the share of your position closed at each stage.
Position size
• Position size (default 1.0, minimum 0, step 0.01): the size of the whole position, in any unit. All volumes are calculated from this number and shown in the same unit.
• Size unit label (default "units"): free text such as lots, contracts or coins. It is only appended to the displayed volumes and has no effect on any calculation.
Staged exit plan (manual-target mode)
• Enable stage 1 / 2 / 3 (default off): turns each stage on. Stage 1 belongs to Target 1, stage 2 to Target 2 and stage 3 to Target 3.
• % closed at stage 1 / 2 / 3 (whole numbers, defaults 30, 30, 20; range 0 to 100): the share of your position closed at each stage.
Line colors
• Entry line (default gray), Stop line (red), Breakeven line (aqua), Target 1 / Stage 1 line (aqua), Target 2 / Stage 2 line (yellow) and Target 3 / Stage 3 line (green). The same colors are used for the labels and the price-axis tags.
█ THE TWO MODES
The switch "Enable" in the group "Single-target % -of-path staging" decides which mode is active. It is off by default, which means Manual-Target mode.
Manual-Target mode (switch off)
• Each stage uses its own target price: stage 1 exits at Target 1, stage 2 at Target 2 and stage 3 at Target 3.
• A stage is active only if its "Enable stage" switch is on and its target is valid (enabled, price not 0, on the profit side of the entry).
• The volume closed at an active stage is: Position size x "% closed" / 100.
• The targets must be in the right order along the trade direction. For a Long: Target 1 < Target 2 < Target 3. For a Short: Target 1 > Target 2 > Target 3. Only enabled targets that have a price are compared. If Target 2 is off, Target 1 is compared directly with Target 3. Two equal prices are not allowed. If the order is wrong, the script stops and shows an error on the chart (see Troubleshooting). This check runs only once a valid entry and stop-loss exist, and never in Single-Target mode.
• A target can be enabled without enabling its stage. Its line and label are still drawn with its price and R:R, but no volume is assigned to it. Such a target can still serve as the exit price of the remaining volume (see How Everything Is Calculated).
Single-Target % of Path mode (switch on)
• Only Target 1 is used. Targets 2 and 3, their enable switches, the "Enable stage" switches and the "% closed" fields of the manual group are all ignored.
• The path is the distance from your entry to Target 1. Each stage sits at a percentage of that path: Stage price = Entry + (Target 1 - Entry) x Path % / 100. So 0% is the entry itself, 50% is halfway to Target 1 and 100% is Target 1.
• All three stages become active automatically as long as Target 1 is valid. You do not need to touch the manual-mode stage switches. Each stage closes its own "% of volume to close".
• The three stages should be set in ascending order of path % (stage 1 lowest, stage 3 highest). The script does not check this for you.
• The lines and labels drawn are the three stage prices. Target 1 itself appears only if one of the stages is set to 100% of the path (the default for stage 3).
• Labels in this mode read "Stage 1 (50% of path)" instead of "Target 1", so you can tell the modes apart at a glance.
In both modes the percentages closed at the active stages must not add up to more than 100. Whatever is not closed by a stage stays open as the remaining volume, described below.
█ WHAT YOU SEE ON THE CHART
The script draws four kinds of output on the price chart: lines, labels, price-axis tags and a summary table.
Lines
• Every line starts at the first bar of the chart and extends to the right, so it stays visible however far you scroll.
• Entry is a solid line, Stop is dashed, Breakeven is dotted, Target 1 / Stage 1 is dotted, Target 2 / Stage 2 is dotted and Target 3 / Stage 3 is solid. Colors are set in "Line colors".
• A line is drawn only for a level that is valid. Without a valid entry and stop-loss nothing is drawn.
Labels (placed just to the right of the latest candle)
• "Entry" and "Stop" followed by their prices.
• "BE trigger -> move stop to" followed by your entry price.
• Manual-Target mode: "Target 1" (or 2, 3) followed by the price and "R:R" with the reward-to-risk multiple of that level. If the stage is active, the label continues with "Close" followed by the percentage and, in brackets, the volume with your unit label.
• Single-Target mode: "Stage 1" (or 2, 3) followed by its percentage of the path, then the price, the R:R and the "Close" part, in the same way.
• Prices follow the tick size of the symbol. R:R values, percentages and volumes are shown with up to two decimals.
Price-axis tags
• Entry, Stop, Breakeven and every valid exit level also appear as colored tags on the right-hand price axis, showing the exact price.
Summary table (top-right corner)
• Direction: Long or Short.
• Final R:R: the reward-to-risk multiple of the entire plan.
• Final Target (avg): the volume-weighted average exit price of the plan.
• BE trigger: the breakeven trigger price, or "not set".
• Stage 1, Stage 2 and Stage 3: each row shows the percentage closed at that stage and the volume with your unit label, or "off" if the stage is not active.
• If the entry or stop-loss is missing, the table instead shows "Set entry / stop-loss" and "in the settings above" on a red background.
If you cannot see the labels, scroll the chart slightly to the left to leave empty space to the right of the last candle.
█ HOW EVERYTHING IS CALCULATED
The calculation runs in twelve steps. Every figure shown on the chart comes from them.
1. Direction. The trade is a Long if the stop-loss is below the entry, otherwise a Short. The risk distance is the absolute difference between entry and stop. The trade is valid only if the entry and the stop are both not 0 and are different from each other.
2. Target validity. A target is valid if it is enabled, its price is not 0 and it lies on the profit side of the entry (above it for a Long, below it for a Short).
3. Stage price. In Manual-Target mode, the stage price is the price of the target with the same number. In Single-Target mode, it is Entry + (Target 1 - Entry) x Path % / 100 for each stage.
4. Stage validity. In Manual-Target mode, a stage is valid when its own target is valid. In Single-Target mode, all three stages are valid when Target 1 is valid.
5. R multiple of a stage = absolute value of (Stage price - Entry) / risk distance. A value of 2.0 means the profit at that level is twice the amount you risk.
6. Active stage. A stage is active when the trade is valid, the stage is valid and either Single-Target mode is on or the stage's "Enable stage" switch is on.
7. Volume of an active stage = Position size x % closed / 100. An inactive stage has a volume of 0.
8. Remaining volume = Position size - the sum of the active stage volumes. This part of the position is called the runner.
9. Runner exit price. The runner is assumed to exit at the farthest valid exit level from the entry in the profit direction (the highest for a Long, the lowest for a Short). All valid levels are considered, including those whose stage is switched off. If there is no valid level, no runner is counted.
10. Profit of a stage = its volume x its distance from the entry in the profit direction. The profit of the runner is calculated the same way with its own volume and the runner exit price. The risk amount = risk distance x Position size.
11. Final R:R = (profit of all active stages + profit of the runner) / risk amount. It is shown only when the risk amount is above 0 and at least one stage is active or a runner is counted. Otherwise the table shows "N/A".
12. Final Target (avg) = the sum of (volume x exit price) over all active stages and the runner, divided by the total volume counted. This is the average price at which your position leaves the market if every planned exit is filled.
Special cases:
• If no stage is active but at least one target is valid, the whole position is treated as a single runner leaving at the farthest valid level. Final R:R then equals that level's R multiple and Final Target equals its price.
• If the percentages of the active stages add up to exactly 100, there is no runner and Final Target is the average of the stage prices weighted by their volumes.
• The percentages of the active stages must never add up to more than 100. In Manual-Target mode every enabled stage is counted, even if its target turns out to be invalid. In Single-Target mode all three stages are always counted. If the sum is above 100, the script stops with an error.
█ WORKED EXAMPLES
The three examples below use round numbers so you can follow every step. The prices are only illustrations, not trade ideas.
Example 1: Manual-Target mode, Long
Settings: Entry 100, Stop-loss 95, Position size 10. Targets 1, 2 and 3 enabled at 105, 110 and 120. Stages 1, 2 and 3 enabled, closing 30%, 30% and 20%.
• Risk distance: 5. Risk amount: 5 x 10 = 50.
• R multiples: Target 1 = 1.00, Target 2 = 2.00, Target 3 = 4.00.
• Volumes: stage 1 = 3, stage 2 = 3, stage 3 = 2. Remaining volume (runner) = 10 - 8 = 2.
• The runner exits at the farthest valid level, which is Target 3 at 120.
• Profits: 3 x 5 = 15, 3 x 10 = 30, 2 x 20 = 40, runner 2 x 20 = 40. Total = 125.
• Final R:R = 125 / 50 = 2.5.
• Final Target (avg) = (3 x 10⁵ + 3 x 110 + 2 x 120 + 2 x 120) / 10 = 112.5.
Example 2: Single-Target % of Path mode, Long
Settings: Entry 100, Stop-loss 95, Position size 10. "Enable" switched on in the single-target group, Target 1 enabled at 110, all other single-target values left at their defaults (paths 50%, 75%, 100%; volumes closed 20%, 30%, 20%). No manual-mode stage switch is touched.
• Stage prices: 100 + (110 - 100) x 50% = 105, then 107.5, then 110.
• R multiples: 1.00, 1.50, 2.00.
• Volumes: stage 1 = 2, stage 2 = 3, stage 3 = 2. Remaining volume = 3, exiting at the farthest level, 110.
• Profits: 2 x 5 = 10, 3 x 7.5 = 22.5, 2 x 10 = 20, runner 3 x 10 = 30. Total = 82.5. Risk amount = 50.
• Final R:R = 82.5 / 50 = 1.65.
• Final Target (avg) = (2 x 10⁵ + 3 x 107.5 + 2 x 110 + 3 x 110) / 10 = 108.25.
Example 3: Manual-Target mode, Short
Settings: Entry 100, Stop-loss 105, Position size 8. Targets 1 and 2 enabled at 90 and 80. Stages 1 and 2 enabled, closing 50% and 25%. Target 3 and stage 3 are off.
• The stop is above the entry, so the trade is a Short. Risk distance: 5. Risk amount: 5 x 8 = 40.
• The target order check passes for a Short because Target 1 (90) is higher than Target 2 (80).
• R multiples: Target 1 = 2.00, Target 2 = 4.00.
• Volumes: stage 1 = 4, stage 2 = 2. Remaining volume = 2, exiting at the farthest valid level, which for a Short is the lowest one, 80.
• Profits (entry minus exit price, times volume): 4 x 10 = 40, 2 x 20 = 40, runner 2 x 20 = 40. Total = 120.
• Final R:R = 120 / 40 = 3.0.
• Final Target (avg) = (4 x 90 + 2 x 80 + 2 x 80) / 8 = 85.
█ TROUBLESHOOTING
Most problems come from one of a few causes. Find the symptom below.
• The table says "Set entry / stop-loss in the settings above", or nothing is drawn: the Entry price or the Stop-loss price is still 0, or both prices are equal. Type two different, non-zero prices.
• A target line or label is missing: the target must be enabled, its price must not be 0 and it must lie on the profit side of the entry (above it for a Long, below it for a Short). In Single-Target mode only Target 1 matters, so check that one.
• In Single-Target mode I cannot see the Target 1 line: the lines are drawn at the stage prices. Target 1 is shown only when one stage is set to 100% of the path.
• A stage shows "off" in the table: in Manual-Target mode, switch on its "Enable stage" switch and make sure its own target is valid. In Single-Target mode, make sure Target 1 is enabled and valid.
• Final R:R and Final Target show "N/A": there is no valid target and no active stage, or the Position size is 0.
• Error "The final value should not be more than 100.": the percentages closed at the active stages add up to more than 100. Lower one or more of them. In Manual-Target mode every enabled stage counts, even if its target is invalid. In Single-Target mode all three stages always count.
• Error "Long position: Target 1 must be lower than Target 2, and Target 2 lower than Target 3.": for a Long, your targets are not in ascending order or two of them are equal. Reorder the prices. This check applies only in Manual-Target mode.
• Error "Short position: Target 1 must be higher than Target 2, and Target 2 higher than Target 3.": the same problem for a Short, where the targets must be in descending order.
• The labels are not visible: scroll the chart so there is empty space to the right of the last candle. The labels are placed there.
• The volumes look too rounded: volumes and percentages are displayed with up to two decimals. See the notes below.
█ LIMITATIONS AND IMPORTANT NOTES
Please read these points before you rely on the numbers.
• This is a planner and calculator only. It places no orders, sends no alerts and does not check whether price has reached any level. The lines are static, and the "move stop to" text on the breakeven label is a reminder, not an action.
• All figures assume that every planned exit is filled exactly at its price and that the stop-loss is not hit first. Commissions, spread, slippage, swap, funding fees and taxes are not included.
• Final R:R and Final Target describe the plan if everything goes as planned. They are optimistic by nature, because the runner is assumed to reach the farthest level.
• The risk amount is a price distance multiplied by your position size, not a money value. Tick values and contract multipliers are not used. The ratios (R multiples, Final R:R and Final Target) are not affected by this, because such factors cancel out. Volumes are expressed in whatever unit you typed.
• Volumes, percentages and R:R values are displayed rounded to two decimals, and no rounding to your broker's lot step or minimum size is done. Round the volumes yourself before placing orders.
• The breakeven trigger is not part of any calculation, and the script does not verify that it sits on the correct side of the entry.
• In Single-Target mode the script does not check that the stage paths are in ascending order.
• Prices are typed in by hand and are tied to the symbol you are viewing. If you switch the chart to another symbol, update the prices.
• One instance of the script plans one trade. To plan a second trade on the same chart, add the indicator a second time and fill in its own settings.
█ DISCLAIMER
Staged Exit Planner is an educational planning and calculation tool. It does not generate trading signals and does not predict price. It does not guarantee any result and is not financial, investment or trading advice. Trading involves a substantial risk of loss, and you alone are responsible for your decisions. Always check the figures against your broker or trading platform before placing any order.
Staged Exit Planner is a trade-planning tool: you enter a trade you have already decided on, and it draws every level on your chart, splits the position into partial exits and calculates the resulting risk-to-reward.
You provide an entry price, a stop-loss price, up to three targets and a position size. The script then shows:
• Horizontal lines for the entry, the stop-loss, an optional breakeven trigger and every exit level.
• A label on each exit level with its price, its R:R (the reward measured in multiples of your risk) and how much of the position to close there.
• The exact prices as colored tags on the right-hand price axis.
• A summary table with the trade direction, the Final R:R of the whole plan and the Final Target, which is the volume-weighted average exit price.
The focus is on what happens when you take profit in stages instead of at a single target. Every partial exit changes both the blended average exit price and the overall R:R, and this tool calculates both for you.
Exits can be staged in two ways. In Manual-Target mode each stage has its own target price. In Single-Target % of Path mode all stages sit at percentages of the distance between the entry and Target 1. Both modes are explained in detail below.
What it is not: it does not find entries, generate signals, place orders, send alerts or track whether price has reached a level. Every number comes from the values you type in. It works on any symbol and timeframe, and it detects Long or Short automatically from where your stop-loss sits relative to your entry.
█ QUICK START
Five steps take you from an empty chart to a complete exit plan.
1. Add the script to your chart and open its settings (Inputs tab). The inputs are grouped in the same order as the sections below.
2. In "Trade levels", type your Entry price and your Stop-loss price. If the stop is below the entry the trade is a Long, if it is above the entry the trade is a Short. Until both prices are valid, the table in the top-right corner shows "Set entry / stop-loss in the settings above".
3. In "Position size", type the size of your position in any unit you like (lots, contracts, coins, shares). Optionally type that unit's name in "Size unit label" so it appears next to every volume.
4. Choose how to stage your exits:
◦ Manual-Target mode (default): in "Targets", enable Target 1 and type its price, and do the same for Targets 2 and 3 if you use them. Then, in "Staged exit plan (manual-target mode)", enable the stages you want and set the % of the position closed at each one.
◦ Single-Target % of Path mode: in "Single-target % -of-path staging", switch on "Enable". Then, in "Targets", enable Target 1 and type its price. All three stages are now active automatically; set where each one sits on the path to Target 1 and how much volume it closes.
5. Optional: type a "Breakeven trigger price" to draw a reminder line for the price where you plan to move your stop to breakeven.
The lines, labels, price-axis tags and the summary table update instantly every time you change a setting.
In both modes Target 1 must be enabled and have a valid price. Without it, no exit level can be drawn.
█ SETTINGS REFERENCE
Every input is listed below in the order it appears in the settings, with its default value.
Trade levels
• Entry price (default 0): the price where you entered, or plan to enter, the trade. It must not be 0.
• Stop-loss price (default 0): the price where the trade is abandoned. It must not be 0 and must differ from the entry. Its position relative to the entry sets the direction: stop below entry = Long, stop above entry = Short.
• Breakeven trigger price (default 0, which hides the line): the price where you plan to move your stop to your entry price. It is drawn as a reminder line labeled "BE trigger -> move stop to" followed by your entry price. It is not used in any calculation and the script does not check which side of the entry you put it on. Place it beyond the entry in the profit direction: above the entry for a Long, below the entry for a Short.
Targets
• Enable Target 1 / 2 / 3 (default off) and Target 1 / 2 / 3 price (default 0): the exit levels used in Manual-Target mode. A target is used only if it is enabled, its price is not 0 and it lies on the profit side of the entry (above it for a Long, below it for a Short). A target that fails any of these conditions is silently ignored: it is not drawn and not counted.
Single-target % -of-path staging
• Enable (default off): switches on Single-Target % of Path mode. While it is on, Targets 2 and 3, the "Enable stage" switches and the "% closed" fields of the manual-target group are ignored.
• Stage 1 / 2 / 3: % of path to Target 1 (defaults 50, 75, 100; range 0 to 100): where each stage sits between the entry (0%) and Target 1 (100%).
• Stage 1 / 2 / 3: % of volume to close (defaults 20, 30, 20; range 0 to 100): the share of your position closed at each stage.
Position size
• Position size (default 1.0, minimum 0, step 0.01): the size of the whole position, in any unit. All volumes are calculated from this number and shown in the same unit.
• Size unit label (default "units"): free text such as lots, contracts or coins. It is only appended to the displayed volumes and has no effect on any calculation.
Staged exit plan (manual-target mode)
• Enable stage 1 / 2 / 3 (default off): turns each stage on. Stage 1 belongs to Target 1, stage 2 to Target 2 and stage 3 to Target 3.
• % closed at stage 1 / 2 / 3 (whole numbers, defaults 30, 30, 20; range 0 to 100): the share of your position closed at each stage.
Line colors
• Entry line (default gray), Stop line (red), Breakeven line (aqua), Target 1 / Stage 1 line (aqua), Target 2 / Stage 2 line (yellow) and Target 3 / Stage 3 line (green). The same colors are used for the labels and the price-axis tags.
█ THE TWO MODES
The switch "Enable" in the group "Single-target % -of-path staging" decides which mode is active. It is off by default, which means Manual-Target mode.
Manual-Target mode (switch off)
• Each stage uses its own target price: stage 1 exits at Target 1, stage 2 at Target 2 and stage 3 at Target 3.
• A stage is active only if its "Enable stage" switch is on and its target is valid (enabled, price not 0, on the profit side of the entry).
• The volume closed at an active stage is: Position size x "% closed" / 100.
• The targets must be in the right order along the trade direction. For a Long: Target 1 < Target 2 < Target 3. For a Short: Target 1 > Target 2 > Target 3. Only enabled targets that have a price are compared. If Target 2 is off, Target 1 is compared directly with Target 3. Two equal prices are not allowed. If the order is wrong, the script stops and shows an error on the chart (see Troubleshooting). This check runs only once a valid entry and stop-loss exist, and never in Single-Target mode.
• A target can be enabled without enabling its stage. Its line and label are still drawn with its price and R:R, but no volume is assigned to it. Such a target can still serve as the exit price of the remaining volume (see How Everything Is Calculated).
Single-Target % of Path mode (switch on)
• Only Target 1 is used. Targets 2 and 3, their enable switches, the "Enable stage" switches and the "% closed" fields of the manual group are all ignored.
• The path is the distance from your entry to Target 1. Each stage sits at a percentage of that path: Stage price = Entry + (Target 1 - Entry) x Path % / 100. So 0% is the entry itself, 50% is halfway to Target 1 and 100% is Target 1.
• All three stages become active automatically as long as Target 1 is valid. You do not need to touch the manual-mode stage switches. Each stage closes its own "% of volume to close".
• The three stages should be set in ascending order of path % (stage 1 lowest, stage 3 highest). The script does not check this for you.
• The lines and labels drawn are the three stage prices. Target 1 itself appears only if one of the stages is set to 100% of the path (the default for stage 3).
• Labels in this mode read "Stage 1 (50% of path)" instead of "Target 1", so you can tell the modes apart at a glance.
In both modes the percentages closed at the active stages must not add up to more than 100. Whatever is not closed by a stage stays open as the remaining volume, described below.
█ WHAT YOU SEE ON THE CHART
The script draws four kinds of output on the price chart: lines, labels, price-axis tags and a summary table.
Lines
• Every line starts at the first bar of the chart and extends to the right, so it stays visible however far you scroll.
• Entry is a solid line, Stop is dashed, Breakeven is dotted, Target 1 / Stage 1 is dotted, Target 2 / Stage 2 is dotted and Target 3 / Stage 3 is solid. Colors are set in "Line colors".
• A line is drawn only for a level that is valid. Without a valid entry and stop-loss nothing is drawn.
Labels (placed just to the right of the latest candle)
• "Entry" and "Stop" followed by their prices.
• "BE trigger -> move stop to" followed by your entry price.
• Manual-Target mode: "Target 1" (or 2, 3) followed by the price and "R:R" with the reward-to-risk multiple of that level. If the stage is active, the label continues with "Close" followed by the percentage and, in brackets, the volume with your unit label.
• Single-Target mode: "Stage 1" (or 2, 3) followed by its percentage of the path, then the price, the R:R and the "Close" part, in the same way.
• Prices follow the tick size of the symbol. R:R values, percentages and volumes are shown with up to two decimals.
Price-axis tags
• Entry, Stop, Breakeven and every valid exit level also appear as colored tags on the right-hand price axis, showing the exact price.
Summary table (top-right corner)
• Direction: Long or Short.
• Final R:R: the reward-to-risk multiple of the entire plan.
• Final Target (avg): the volume-weighted average exit price of the plan.
• BE trigger: the breakeven trigger price, or "not set".
• Stage 1, Stage 2 and Stage 3: each row shows the percentage closed at that stage and the volume with your unit label, or "off" if the stage is not active.
• If the entry or stop-loss is missing, the table instead shows "Set entry / stop-loss" and "in the settings above" on a red background.
If you cannot see the labels, scroll the chart slightly to the left to leave empty space to the right of the last candle.
█ HOW EVERYTHING IS CALCULATED
The calculation runs in twelve steps. Every figure shown on the chart comes from them.
1. Direction. The trade is a Long if the stop-loss is below the entry, otherwise a Short. The risk distance is the absolute difference between entry and stop. The trade is valid only if the entry and the stop are both not 0 and are different from each other.
2. Target validity. A target is valid if it is enabled, its price is not 0 and it lies on the profit side of the entry (above it for a Long, below it for a Short).
3. Stage price. In Manual-Target mode, the stage price is the price of the target with the same number. In Single-Target mode, it is Entry + (Target 1 - Entry) x Path % / 100 for each stage.
4. Stage validity. In Manual-Target mode, a stage is valid when its own target is valid. In Single-Target mode, all three stages are valid when Target 1 is valid.
5. R multiple of a stage = absolute value of (Stage price - Entry) / risk distance. A value of 2.0 means the profit at that level is twice the amount you risk.
6. Active stage. A stage is active when the trade is valid, the stage is valid and either Single-Target mode is on or the stage's "Enable stage" switch is on.
7. Volume of an active stage = Position size x % closed / 100. An inactive stage has a volume of 0.
8. Remaining volume = Position size - the sum of the active stage volumes. This part of the position is called the runner.
9. Runner exit price. The runner is assumed to exit at the farthest valid exit level from the entry in the profit direction (the highest for a Long, the lowest for a Short). All valid levels are considered, including those whose stage is switched off. If there is no valid level, no runner is counted.
10. Profit of a stage = its volume x its distance from the entry in the profit direction. The profit of the runner is calculated the same way with its own volume and the runner exit price. The risk amount = risk distance x Position size.
11. Final R:R = (profit of all active stages + profit of the runner) / risk amount. It is shown only when the risk amount is above 0 and at least one stage is active or a runner is counted. Otherwise the table shows "N/A".
12. Final Target (avg) = the sum of (volume x exit price) over all active stages and the runner, divided by the total volume counted. This is the average price at which your position leaves the market if every planned exit is filled.
Special cases:
• If no stage is active but at least one target is valid, the whole position is treated as a single runner leaving at the farthest valid level. Final R:R then equals that level's R multiple and Final Target equals its price.
• If the percentages of the active stages add up to exactly 100, there is no runner and Final Target is the average of the stage prices weighted by their volumes.
• The percentages of the active stages must never add up to more than 100. In Manual-Target mode every enabled stage is counted, even if its target turns out to be invalid. In Single-Target mode all three stages are always counted. If the sum is above 100, the script stops with an error.
█ WORKED EXAMPLES
The three examples below use round numbers so you can follow every step. The prices are only illustrations, not trade ideas.
Example 1: Manual-Target mode, Long
Settings: Entry 100, Stop-loss 95, Position size 10. Targets 1, 2 and 3 enabled at 105, 110 and 120. Stages 1, 2 and 3 enabled, closing 30%, 30% and 20%.
• Risk distance: 5. Risk amount: 5 x 10 = 50.
• R multiples: Target 1 = 1.00, Target 2 = 2.00, Target 3 = 4.00.
• Volumes: stage 1 = 3, stage 2 = 3, stage 3 = 2. Remaining volume (runner) = 10 - 8 = 2.
• The runner exits at the farthest valid level, which is Target 3 at 120.
• Profits: 3 x 5 = 15, 3 x 10 = 30, 2 x 20 = 40, runner 2 x 20 = 40. Total = 125.
• Final R:R = 125 / 50 = 2.5.
• Final Target (avg) = (3 x 10⁵ + 3 x 110 + 2 x 120 + 2 x 120) / 10 = 112.5.
Example 2: Single-Target % of Path mode, Long
Settings: Entry 100, Stop-loss 95, Position size 10. "Enable" switched on in the single-target group, Target 1 enabled at 110, all other single-target values left at their defaults (paths 50%, 75%, 100%; volumes closed 20%, 30%, 20%). No manual-mode stage switch is touched.
• Stage prices: 100 + (110 - 100) x 50% = 105, then 107.5, then 110.
• R multiples: 1.00, 1.50, 2.00.
• Volumes: stage 1 = 2, stage 2 = 3, stage 3 = 2. Remaining volume = 3, exiting at the farthest level, 110.
• Profits: 2 x 5 = 10, 3 x 7.5 = 22.5, 2 x 10 = 20, runner 3 x 10 = 30. Total = 82.5. Risk amount = 50.
• Final R:R = 82.5 / 50 = 1.65.
• Final Target (avg) = (2 x 10⁵ + 3 x 107.5 + 2 x 110 + 3 x 110) / 10 = 108.25.
Example 3: Manual-Target mode, Short
Settings: Entry 100, Stop-loss 105, Position size 8. Targets 1 and 2 enabled at 90 and 80. Stages 1 and 2 enabled, closing 50% and 25%. Target 3 and stage 3 are off.
• The stop is above the entry, so the trade is a Short. Risk distance: 5. Risk amount: 5 x 8 = 40.
• The target order check passes for a Short because Target 1 (90) is higher than Target 2 (80).
• R multiples: Target 1 = 2.00, Target 2 = 4.00.
• Volumes: stage 1 = 4, stage 2 = 2. Remaining volume = 2, exiting at the farthest valid level, which for a Short is the lowest one, 80.
• Profits (entry minus exit price, times volume): 4 x 10 = 40, 2 x 20 = 40, runner 2 x 20 = 40. Total = 120.
• Final R:R = 120 / 40 = 3.0.
• Final Target (avg) = (4 x 90 + 2 x 80 + 2 x 80) / 8 = 85.
█ TROUBLESHOOTING
Most problems come from one of a few causes. Find the symptom below.
• The table says "Set entry / stop-loss in the settings above", or nothing is drawn: the Entry price or the Stop-loss price is still 0, or both prices are equal. Type two different, non-zero prices.
• A target line or label is missing: the target must be enabled, its price must not be 0 and it must lie on the profit side of the entry (above it for a Long, below it for a Short). In Single-Target mode only Target 1 matters, so check that one.
• In Single-Target mode I cannot see the Target 1 line: the lines are drawn at the stage prices. Target 1 is shown only when one stage is set to 100% of the path.
• A stage shows "off" in the table: in Manual-Target mode, switch on its "Enable stage" switch and make sure its own target is valid. In Single-Target mode, make sure Target 1 is enabled and valid.
• Final R:R and Final Target show "N/A": there is no valid target and no active stage, or the Position size is 0.
• Error "The final value should not be more than 100.": the percentages closed at the active stages add up to more than 100. Lower one or more of them. In Manual-Target mode every enabled stage counts, even if its target is invalid. In Single-Target mode all three stages always count.
• Error "Long position: Target 1 must be lower than Target 2, and Target 2 lower than Target 3.": for a Long, your targets are not in ascending order or two of them are equal. Reorder the prices. This check applies only in Manual-Target mode.
• Error "Short position: Target 1 must be higher than Target 2, and Target 2 higher than Target 3.": the same problem for a Short, where the targets must be in descending order.
• The labels are not visible: scroll the chart so there is empty space to the right of the last candle. The labels are placed there.
• The volumes look too rounded: volumes and percentages are displayed with up to two decimals. See the notes below.
█ LIMITATIONS AND IMPORTANT NOTES
Please read these points before you rely on the numbers.
• This is a planner and calculator only. It places no orders, sends no alerts and does not check whether price has reached any level. The lines are static, and the "move stop to" text on the breakeven label is a reminder, not an action.
• All figures assume that every planned exit is filled exactly at its price and that the stop-loss is not hit first. Commissions, spread, slippage, swap, funding fees and taxes are not included.
• Final R:R and Final Target describe the plan if everything goes as planned. They are optimistic by nature, because the runner is assumed to reach the farthest level.
• The risk amount is a price distance multiplied by your position size, not a money value. Tick values and contract multipliers are not used. The ratios (R multiples, Final R:R and Final Target) are not affected by this, because such factors cancel out. Volumes are expressed in whatever unit you typed.
• Volumes, percentages and R:R values are displayed rounded to two decimals, and no rounding to your broker's lot step or minimum size is done. Round the volumes yourself before placing orders.
• The breakeven trigger is not part of any calculation, and the script does not verify that it sits on the correct side of the entry.
• In Single-Target mode the script does not check that the stage paths are in ascending order.
• Prices are typed in by hand and are tied to the symbol you are viewing. If you switch the chart to another symbol, update the prices.
• One instance of the script plans one trade. To plan a second trade on the same chart, add the indicator a second time and fill in its own settings.
█ DISCLAIMER
Staged Exit Planner is an educational planning and calculation tool. It does not generate trading signals and does not predict price. It does not guarantee any result and is not financial, investment or trading advice. Trading involves a substantial risk of loss, and you alone are responsible for your decisions. Always check the figures against your broker or trading platform before placing any order.

📉 Trading without a plan is gambling💸!?
NOT HERE‼️
Real entry, stop-loss & target — R:R tracked live ✅
🟢 Channel: t.me/MasterHunterAnalysis
🔵 X: x.com/Master_HunterX
🔴 Contact: t.me/MasterHunterTrade
NOT HERE‼️
Real entry, stop-loss & target — R:R tracked live ✅
🟢 Channel: t.me/MasterHunterAnalysis
🔵 X: x.com/Master_HunterX
🔴 Contact: t.me/MasterHunterTrade
Feragatname
Bilgiler ve yayınlar, TradingView tarafından sağlanan veya onaylanan finansal, yatırım, alım satım veya diğer türden tavsiye veya öneriler anlamına gelmez ve teşkil etmez. Kullanım Koşulları bölümünde daha fazlasını okuyun.
📉 Trading without a plan is gambling💸!?
NOT HERE‼️
Real entry, stop-loss & target — R:R tracked live ✅
🟢 Channel: t.me/MasterHunterAnalysis
🔵 X: x.com/Master_HunterX
🔴 Contact: t.me/MasterHunterTrade
NOT HERE‼️
Real entry, stop-loss & target — R:R tracked live ✅
🟢 Channel: t.me/MasterHunterAnalysis
🔵 X: x.com/Master_HunterX
🔴 Contact: t.me/MasterHunterTrade
Feragatname
Bilgiler ve yayınlar, TradingView tarafından sağlanan veya onaylanan finansal, yatırım, alım satım veya diğer türden tavsiye veya öneriler anlamına gelmez ve teşkil etmez. Kullanım Koşulları bölümünde daha fazlasını okuyun.