OPEN-SOURCE SCRIPT
RSI + ZC COG Candles + Buy Signal
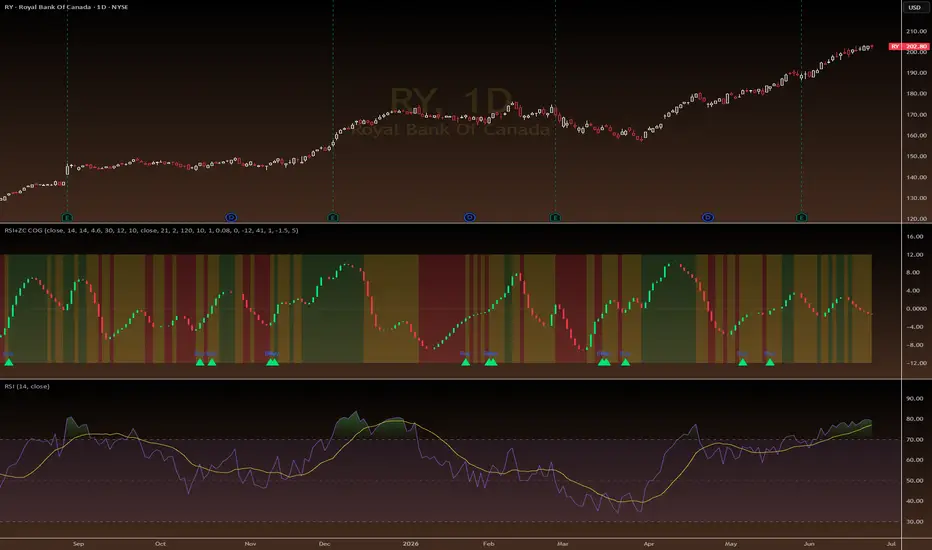
This script combines a normalized Center of Gravity (ZC COG) candle view with an RSI color regime and a context‑aware buy signal filter.
The RSI block builds a three‑state background:
On top of that regime, the script plots ZC COG candles, where price is transformed into a normalized oscillator:
The buy signal layer is designed to look for potential mean‑reversion moves out of recent red RSI zones, while trying to avoid most obvious bad contexts:
This indicator is meant to be used together with a standard RSI 14 for divergence work:
How to use it
Disclaimer
This script is provided for educational purposes only.
It does not constitute financial advice, trade recommendations, or a solicitation to buy or sell any security or instrument.
Markets can react unexpectedly to:earnings releases, macro events, company‑specific news, liquidity shocks, and overnight gaps.
No indicator, including this one, can fully protect you from those events, and there is always a risk of loss when trading or investing.
Past performance and historical patterns do not guarantee future results.
Always do your own research, adapt parameters to your own strategy, and consult a qualified financial professional if you need personalized advice. Your capital is at risk and you remain fully responsible for your decisions.
The RSI block builds a three‑state background:
- Green when RSI trades above an adaptive band around its SMA (strong momentum zone).
- Yellow when price is neither strongly oversold nor strongly overbought (neutral / transition zone).
- Red when RSI drops below a forced level or below the lower band (downtrending / risk zone).
On top of that regime, the script plots ZC COG candles, where price is transformed into a normalized oscillator:
- COG is centered, scaled to a fixed half‑range, optionally quantized, then drawn as synthetic candles with body and wick.
- This gives a clean visual of swings and turning points, independent of the raw price scale.
The buy signal layer is designed to look for potential mean‑reversion moves out of recent red RSI zones, while trying to avoid most obvious bad contexts:
- Candles must close positively in the COG space.
- A configurable number of bars back (default: 5) is optionally checked to ensure the current candle is closing below a previous reference candle.
- The RSI must be above a minimum level and above an offset‑adjusted RSI SMA, so you can allow a small margin under the SMA if needed.
- A “recent red zone” filter requires that a red RSI regime occurred within a user‑defined lookback window, to focus on bounce‑type setups rather than chasing extended trends.
This indicator is meant to be used together with a standard RSI 14 for divergence work:
- The buy markers highlight structural contexts where a bounce could make sense.
- The separate RSI 14 helps you confirm bullish divergences and filter out false signals.
- Without that divergence layer, you should expect more noise and more traps around earnings, gaps, and fast news moves.
How to use it
- Apply this script and a classic RSI 14 on your chart.
- Use the colored background and COG candles to understand the current regime and local swings.
- Treat the buy signals as potential bounce zones, not guaranteed entries.
- Confirm using RSI 14 divergences, higher‑timeframe structure, and your own risk management rules.
Disclaimer
This script is provided for educational purposes only.
It does not constitute financial advice, trade recommendations, or a solicitation to buy or sell any security or instrument.
Markets can react unexpectedly to:earnings releases, macro events, company‑specific news, liquidity shocks, and overnight gaps.
No indicator, including this one, can fully protect you from those events, and there is always a risk of loss when trading or investing.
Past performance and historical patterns do not guarantee future results.
Always do your own research, adapt parameters to your own strategy, and consult a qualified financial professional if you need personalized advice. Your capital is at risk and you remain fully responsible for your decisions.
Açık kaynak kodlu komut dosyası
Gerçek TradingView ruhuyla, bu komut dosyasının mimarı, yatırımcıların işlevselliğini inceleyip doğrulayabilmesi için onu açık kaynaklı hale getirdi. Yazarı tebrik ederiz! Ücretsiz olarak kullanabilseniz de, kodu yeniden yayınlamanın Topluluk Kurallarımıza tabi olduğunu unutmayın.

Feragatname
Bilgiler ve yayınlar, TradingView tarafından sağlanan veya onaylanan finansal, yatırım, alım satım veya diğer türden tavsiye veya öneriler anlamına gelmez ve teşkil etmez. Kullanım Koşulları bölümünde daha fazlasını okuyun.
Açık kaynak kodlu komut dosyası
Gerçek TradingView ruhuyla, bu komut dosyasının mimarı, yatırımcıların işlevselliğini inceleyip doğrulayabilmesi için onu açık kaynaklı hale getirdi. Yazarı tebrik ederiz! Ücretsiz olarak kullanabilseniz de, kodu yeniden yayınlamanın Topluluk Kurallarımıza tabi olduğunu unutmayın.
Feragatname
Bilgiler ve yayınlar, TradingView tarafından sağlanan veya onaylanan finansal, yatırım, alım satım veya diğer türden tavsiye veya öneriler anlamına gelmez ve teşkil etmez. Kullanım Koşulları bölümünde daha fazlasını okuyun.