OPEN-SOURCE SCRIPT
Darwin 40-40 Midline
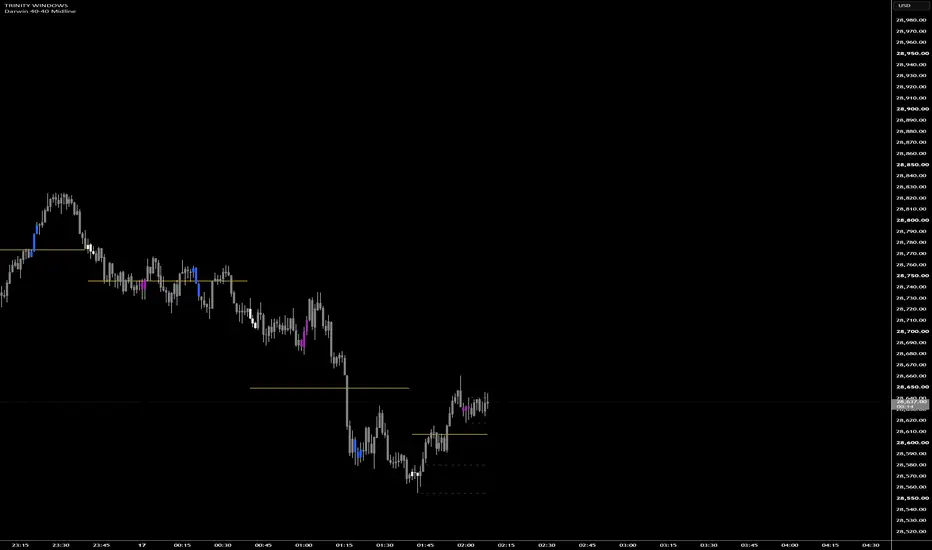
The Darwin 40-40 Midline is a custom overlay indicator designed to track and display a dynamic midpoint of price action, anchoring to a specific time interval. Rather than using standard hourly or daily resets, this script resets its tracking specifically at the 40th minute of every hour, providing a unique intra-hour perspective on price equilibrium.
How It Works (The Logic)
This indicator utilizes a dynamic high/low range calculation to plot a continuous midline:
The Reset: The script monitors the timestamp of each bar. As soon as the time hits the 40th minute of the hour (e.g., 09:40, 10:40, 11:40), the indicator resets its internal high and low anchor points to the high and low of that specific bar.
The Dynamic Midpoint: For every subsequent bar following the 40-minute mark, the script checks if price has broken the anchored high or low. If a new high or low is established, the range is updated.
The Plot: The indicator dynamically draws a line at the exact mathematical center of this expanding range (Highest High + Lowest Low) / 2. The line extends forward with each new bar, visually adjusting its level in real-time as the range expands.
How to Use It
Traders often use dynamic midpoints as shifting zones of support, resistance, or trend bias:
Trend Bias: When the price sustains itself above the active midline, the intra-hour bias can be interpreted as bullish. Conversely, trading below the midline suggests a bearish bias.
Mean Reversion: In ranging environments, extended moves away from the midline might be viewed as overextended, with the midline acting as a natural magnet for mean-reversion trades.
Breakouts: A sudden expansion of the range (which shifts the midline drastically) can highlight increasing volatility and potential breakout direction following the 40-minute reset.
Settings & Customization
The indicator includes a dedicated "Midline Settings" group in the configuration menu, allowing users to fully customize the visual appearance of the line to fit any chart theme. Users can adjust:
Midline Color: Change the color of the dynamic line (defaults to yellow).
Midline Width: Adjust the thickness of the line (1 to 5).
Style: Choose between Solid, Dashed, or Dotted line styles.
happy Trading!!!!
How It Works (The Logic)
This indicator utilizes a dynamic high/low range calculation to plot a continuous midline:
The Reset: The script monitors the timestamp of each bar. As soon as the time hits the 40th minute of the hour (e.g., 09:40, 10:40, 11:40), the indicator resets its internal high and low anchor points to the high and low of that specific bar.
The Dynamic Midpoint: For every subsequent bar following the 40-minute mark, the script checks if price has broken the anchored high or low. If a new high or low is established, the range is updated.
The Plot: The indicator dynamically draws a line at the exact mathematical center of this expanding range (Highest High + Lowest Low) / 2. The line extends forward with each new bar, visually adjusting its level in real-time as the range expands.
How to Use It
Traders often use dynamic midpoints as shifting zones of support, resistance, or trend bias:
Trend Bias: When the price sustains itself above the active midline, the intra-hour bias can be interpreted as bullish. Conversely, trading below the midline suggests a bearish bias.
Mean Reversion: In ranging environments, extended moves away from the midline might be viewed as overextended, with the midline acting as a natural magnet for mean-reversion trades.
Breakouts: A sudden expansion of the range (which shifts the midline drastically) can highlight increasing volatility and potential breakout direction following the 40-minute reset.
Settings & Customization
The indicator includes a dedicated "Midline Settings" group in the configuration menu, allowing users to fully customize the visual appearance of the line to fit any chart theme. Users can adjust:
Midline Color: Change the color of the dynamic line (defaults to yellow).
Midline Width: Adjust the thickness of the line (1 to 5).
Style: Choose between Solid, Dashed, or Dotted line styles.
happy Trading!!!!
Açık kaynak kodlu komut dosyası
Gerçek TradingView ruhuyla, bu komut dosyasının mimarı, yatırımcıların işlevselliğini inceleyip doğrulayabilmesi için onu açık kaynaklı hale getirdi. Yazarı tebrik ederiz! Ücretsiz olarak kullanabilseniz de, kodu yeniden yayınlamanın Topluluk Kurallarımıza tabi olduğunu unutmayın.

*PM me after for access.*
Feragatname
Bilgiler ve yayınlar, TradingView tarafından sağlanan veya onaylanan finansal, yatırım, alım satım veya diğer türden tavsiye veya öneriler anlamına gelmez ve teşkil etmez. Kullanım Koşulları bölümünde daha fazlasını okuyun.
Açık kaynak kodlu komut dosyası
Gerçek TradingView ruhuyla, bu komut dosyasının mimarı, yatırımcıların işlevselliğini inceleyip doğrulayabilmesi için onu açık kaynaklı hale getirdi. Yazarı tebrik ederiz! Ücretsiz olarak kullanabilseniz de, kodu yeniden yayınlamanın Topluluk Kurallarımıza tabi olduğunu unutmayın.
*PM me after for access.*
Feragatname
Bilgiler ve yayınlar, TradingView tarafından sağlanan veya onaylanan finansal, yatırım, alım satım veya diğer türden tavsiye veya öneriler anlamına gelmez ve teşkil etmez. Kullanım Koşulları bölümünde daha fazlasını okuyun.