OPEN-SOURCE SCRIPT
CVD Oscillator (BEST)
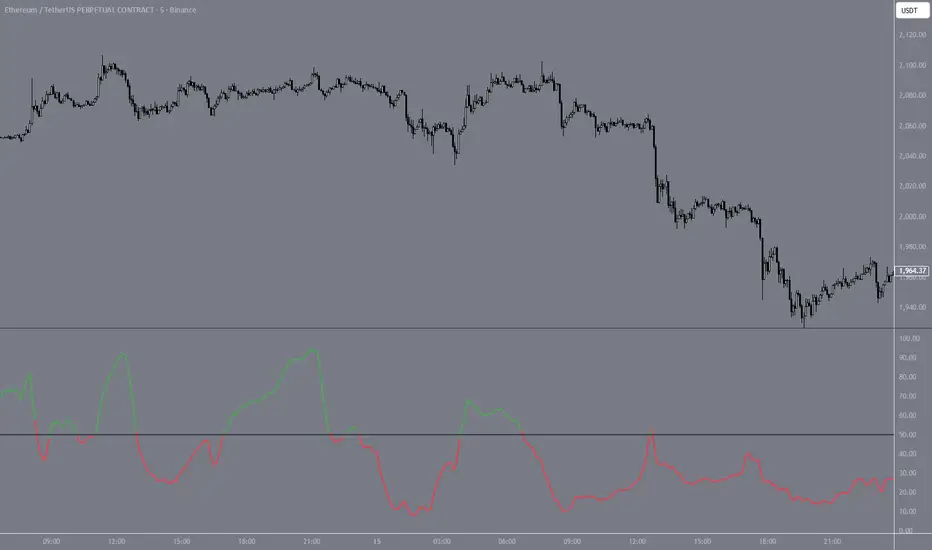
Estimates Cumulative Volume Delta from OHLCV candle data and normalizes it to a 0-100 scale. Approximates order flow without tick-level data by measuring where each candle closes within its range, weighted by volume — closes near the high register as buying pressure, closes near the low as selling pressure.
The raw CVD is normalized over a rolling lookback window and smoothed with an EMA. Readings above 50 indicate buyers dominating relative to recent history, below 50 indicates sellers. Useful for spotting divergences between price and volume flow — e.g. price making new highs while the oscillator declines suggests weakening buyer conviction.
The raw CVD is normalized over a rolling lookback window and smoothed with an EMA. Readings above 50 indicate buyers dominating relative to recent history, below 50 indicates sellers. Useful for spotting divergences between price and volume flow — e.g. price making new highs while the oscillator declines suggests weakening buyer conviction.
Açık kaynak kodlu komut dosyası
Gerçek TradingView ruhuyla, bu komut dosyasının mimarı, yatırımcıların işlevselliğini inceleyip doğrulayabilmesi için onu açık kaynaklı hale getirdi. Yazarı tebrik ederiz! Ücretsiz olarak kullanabilseniz de, kodu yeniden yayınlamanın Topluluk Kurallarımıza tabi olduğunu unutmayın.

Feragatname
Bilgiler ve yayınlar, TradingView tarafından sağlanan veya onaylanan finansal, yatırım, alım satım veya diğer türden tavsiye veya öneriler anlamına gelmez ve teşkil etmez. Kullanım Koşulları bölümünde daha fazlasını okuyun.
Açık kaynak kodlu komut dosyası
Gerçek TradingView ruhuyla, bu komut dosyasının mimarı, yatırımcıların işlevselliğini inceleyip doğrulayabilmesi için onu açık kaynaklı hale getirdi. Yazarı tebrik ederiz! Ücretsiz olarak kullanabilseniz de, kodu yeniden yayınlamanın Topluluk Kurallarımıza tabi olduğunu unutmayın.
Feragatname
Bilgiler ve yayınlar, TradingView tarafından sağlanan veya onaylanan finansal, yatırım, alım satım veya diğer türden tavsiye veya öneriler anlamına gelmez ve teşkil etmez. Kullanım Koşulları bölümünde daha fazlasını okuyun.