OPEN-SOURCE SCRIPT
Micro Harmonic Swing Rhythm Meter + Structure Panel
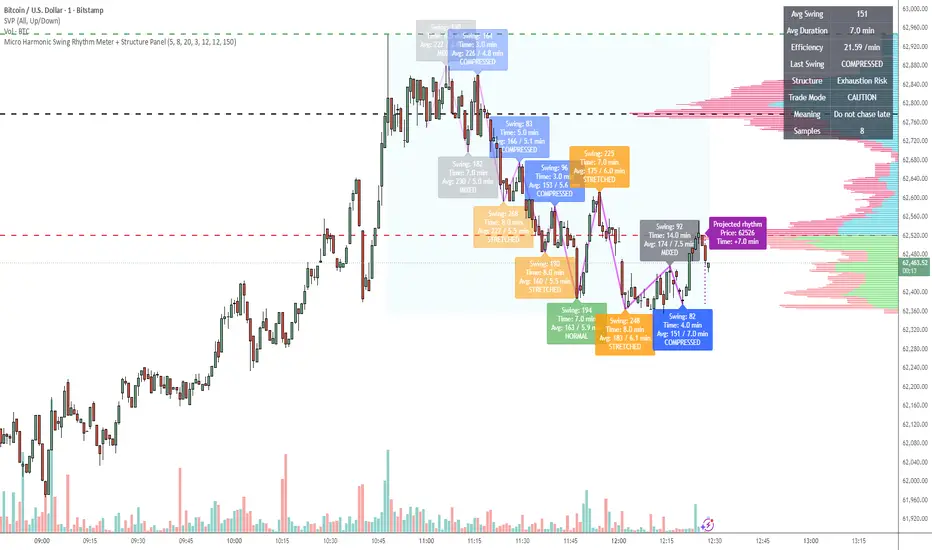
Micro Harmonic Swing Rhythm Meter
Overview
Inspired by the observation that markets often oscillate in recurring harmonic swings of both price and time.
The Micro Harmonic Swing Rhythm Meter is a market structure and rhythm analysis tool designed to identify recurring swing behavior in price action.
Rather than focusing on traditional indicators such as momentum, trend, or overbought/oversold conditions, this indicator measures the repeating "heartbeat" of the market by tracking swing size, swing duration, and the evolving rhythm between successive price pivots.
The objective is not to predict price, but to monitor whether the current auction process remains stable, is compressing, expanding, or becoming exhausted.
Core Concepts
Every market exhibits recurring oscillations.
These oscillations often develop with similar:
* Price amplitude
* Swing duration
* Expansion and contraction cycles
The indicator automatically detects swing pivots and measures:
* Swing Size
* Swing Duration
* Average Swing Size
* Average Swing Duration
* Swing Efficiency
* Market Rhythm State
By comparing the current swing against recent averages, the indicator evaluates whether price action remains in harmony with its established rhythm.
Rhythm States
NORMAL
Current swing size and duration remain close to recent averages.
Interpretation:
* Stable auction
* Balanced market conditions
* Established rhythm remains intact
COMPRESSED
Current swing size and duration are smaller than average.
Interpretation:
* Energy accumulation
* Contracting auction
* Potential precursor to expansion
STRETCHED
Current swing size and duration exceed recent averages.
Interpretation:
* Expansion phase
* Strong directional movement
* Possible acceleration or exhaustion
MIXED
Price amplitude and swing duration are no longer synchronized.
Interpretation:
* Transitional market behavior
* Changing auction structure
* Reduced rhythm consistency
Market Structure Assessment
The indicator automatically classifies recent swing behavior into higher-order structure states.
Possible structure classifications include:
Balanced Rotation
Stable oscillatory conditions.
Trade Mode:
Range Mode
Compression / Coiling
Multiple compressed swings indicate energy accumulation.
Trade Mode:
Breakout Watch
Expansion Attempt
Expansion emerges following a period of compression.
Trade Mode:
Confirm Breakout
Exhaustion Risk
Repeated stretched swings suggest mature directional movement.
Trade Mode:
Caution
Unstable Auction
Excessive mixed swings indicate poor rhythm consistency.
Trade Mode:
Wait
Efficiency Metric
Efficiency is calculated as:
Average Swing Size ÷ Average Swing Duration
This metric measures how much distance price is covering per unit of time.
Rising efficiency often indicates increasing participation and directional conviction.
Falling efficiency often indicates slowing market activity and declining momentum.
Intended Usage
This indicator is designed primarily as a market state monitor rather than a signal generator.
It may be used alongside:
* Price action analysis
* Volume analysis
* Order flow tools
* VWAP frameworks
* Market profile
* Liquidity analysis
The indicator is particularly useful for identifying:
* Compression before expansion
* Changes in auction rhythm
* Developing directional impulses
* Potential exhaustion conditions
Recommended Workflow
Higher timeframes may be used to determine dominant market structure while lower timeframes are used for execution.
Example:
30-minute chart:
Market structure and session rhythm
5-minute chart:
Tactical structure
1-minute chart:
Execution and timing
This multi-timeframe approach allows traders to align lower timeframe opportunities with higher timeframe rhythm conditions.
Disclaimer
This indicator is designed to assist with market observation and structure analysis. It does not provide trading advice and should not be interpreted as a standalone buy or sell signal.
Overview
Inspired by the observation that markets often oscillate in recurring harmonic swings of both price and time.
The Micro Harmonic Swing Rhythm Meter is a market structure and rhythm analysis tool designed to identify recurring swing behavior in price action.
Rather than focusing on traditional indicators such as momentum, trend, or overbought/oversold conditions, this indicator measures the repeating "heartbeat" of the market by tracking swing size, swing duration, and the evolving rhythm between successive price pivots.
The objective is not to predict price, but to monitor whether the current auction process remains stable, is compressing, expanding, or becoming exhausted.
Core Concepts
Every market exhibits recurring oscillations.
These oscillations often develop with similar:
* Price amplitude
* Swing duration
* Expansion and contraction cycles
The indicator automatically detects swing pivots and measures:
* Swing Size
* Swing Duration
* Average Swing Size
* Average Swing Duration
* Swing Efficiency
* Market Rhythm State
By comparing the current swing against recent averages, the indicator evaluates whether price action remains in harmony with its established rhythm.
Rhythm States
NORMAL
Current swing size and duration remain close to recent averages.
Interpretation:
* Stable auction
* Balanced market conditions
* Established rhythm remains intact
COMPRESSED
Current swing size and duration are smaller than average.
Interpretation:
* Energy accumulation
* Contracting auction
* Potential precursor to expansion
STRETCHED
Current swing size and duration exceed recent averages.
Interpretation:
* Expansion phase
* Strong directional movement
* Possible acceleration or exhaustion
MIXED
Price amplitude and swing duration are no longer synchronized.
Interpretation:
* Transitional market behavior
* Changing auction structure
* Reduced rhythm consistency
Market Structure Assessment
The indicator automatically classifies recent swing behavior into higher-order structure states.
Possible structure classifications include:
Balanced Rotation
Stable oscillatory conditions.
Trade Mode:
Range Mode
Compression / Coiling
Multiple compressed swings indicate energy accumulation.
Trade Mode:
Breakout Watch
Expansion Attempt
Expansion emerges following a period of compression.
Trade Mode:
Confirm Breakout
Exhaustion Risk
Repeated stretched swings suggest mature directional movement.
Trade Mode:
Caution
Unstable Auction
Excessive mixed swings indicate poor rhythm consistency.
Trade Mode:
Wait
Efficiency Metric
Efficiency is calculated as:
Average Swing Size ÷ Average Swing Duration
This metric measures how much distance price is covering per unit of time.
Rising efficiency often indicates increasing participation and directional conviction.
Falling efficiency often indicates slowing market activity and declining momentum.
Intended Usage
This indicator is designed primarily as a market state monitor rather than a signal generator.
It may be used alongside:
* Price action analysis
* Volume analysis
* Order flow tools
* VWAP frameworks
* Market profile
* Liquidity analysis
The indicator is particularly useful for identifying:
* Compression before expansion
* Changes in auction rhythm
* Developing directional impulses
* Potential exhaustion conditions
Recommended Workflow
Higher timeframes may be used to determine dominant market structure while lower timeframes are used for execution.
Example:
30-minute chart:
Market structure and session rhythm
5-minute chart:
Tactical structure
1-minute chart:
Execution and timing
This multi-timeframe approach allows traders to align lower timeframe opportunities with higher timeframe rhythm conditions.
Disclaimer
This indicator is designed to assist with market observation and structure analysis. It does not provide trading advice and should not be interpreted as a standalone buy or sell signal.
Açık kaynak kodlu komut dosyası
Gerçek TradingView ruhuyla, bu komut dosyasının mimarı, yatırımcıların işlevselliğini inceleyip doğrulayabilmesi için onu açık kaynaklı hale getirdi. Yazarı tebrik ederiz! Ücretsiz olarak kullanabilseniz de, kodu yeniden yayınlamanın Topluluk Kurallarımıza tabi olduğunu unutmayın.

Feragatname
Bilgiler ve yayınlar, TradingView tarafından sağlanan veya onaylanan finansal, yatırım, alım satım veya diğer türden tavsiye veya öneriler anlamına gelmez ve teşkil etmez. Kullanım Koşulları bölümünde daha fazlasını okuyun.
Açık kaynak kodlu komut dosyası
Gerçek TradingView ruhuyla, bu komut dosyasının mimarı, yatırımcıların işlevselliğini inceleyip doğrulayabilmesi için onu açık kaynaklı hale getirdi. Yazarı tebrik ederiz! Ücretsiz olarak kullanabilseniz de, kodu yeniden yayınlamanın Topluluk Kurallarımıza tabi olduğunu unutmayın.
Feragatname
Bilgiler ve yayınlar, TradingView tarafından sağlanan veya onaylanan finansal, yatırım, alım satım veya diğer türden tavsiye veya öneriler anlamına gelmez ve teşkil etmez. Kullanım Koşulları bölümünde daha fazlasını okuyun.