SachinRkGandhi India VIX Live
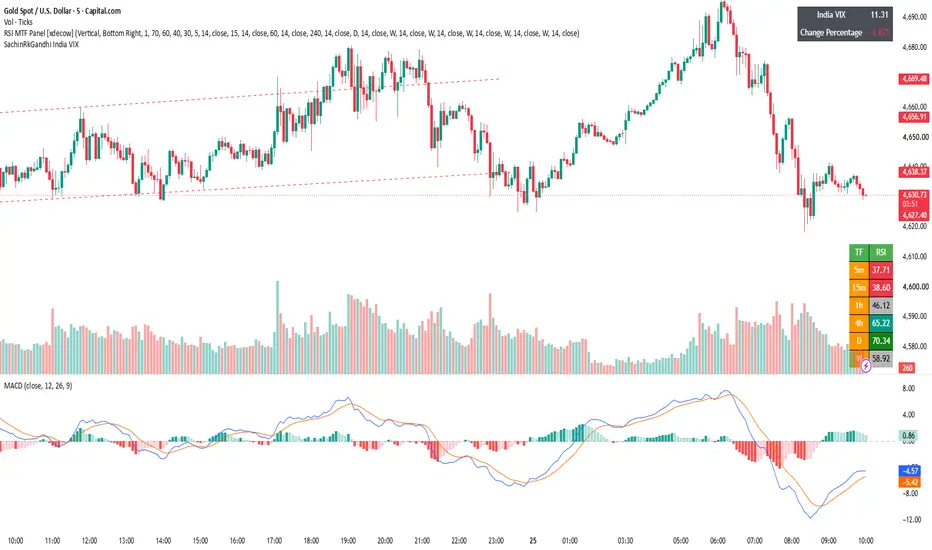
# India VIX Live Value & Change Percentage Indicator
**India VIX by Sachin Raj Kumar Gandhi** is a TradingView indicator designed to provide a quick and clear view of the **live India VIX (Volatility Index) value** directly on the price chart.
The indicator displays:
* **India VIX – Live Value**
* **Change Percentage – Live % Change**
By keeping the India VIX information directly on the chart, traders can quickly monitor changes in market volatility without switching to a separate indicator panel.
### How It Helps
India VIX reflects the expected volatility in the Indian equity market. Monitoring its movement can provide useful context for **intraday trading, scalping, and short-term trade management**.
A rising VIX may indicate increasing market uncertainty and volatility, while a falling VIX may indicate relatively lower expected volatility.
This indicator can therefore be used alongside **Price Action, Technical Indicators, Options Data, and Market Structure** to help traders understand the prevailing volatility environment.
**Designed by Sachin Raj Kumar Gandhi**
*For educational and analytical purposes only. It is not a trading recommendation or financial advice.*
**India VIX by Sachin Raj Kumar Gandhi** is a TradingView indicator designed to provide a quick and clear view of the **live India VIX (Volatility Index) value** directly on the price chart.
The indicator displays:
* **India VIX – Live Value**
* **Change Percentage – Live % Change**
By keeping the India VIX information directly on the chart, traders can quickly monitor changes in market volatility without switching to a separate indicator panel.
### How It Helps
India VIX reflects the expected volatility in the Indian equity market. Monitoring its movement can provide useful context for **intraday trading, scalping, and short-term trade management**.
A rising VIX may indicate increasing market uncertainty and volatility, while a falling VIX may indicate relatively lower expected volatility.
This indicator can therefore be used alongside **Price Action, Technical Indicators, Options Data, and Market Structure** to help traders understand the prevailing volatility environment.
**Designed by Sachin Raj Kumar Gandhi**
*For educational and analytical purposes only. It is not a trading recommendation or financial advice.*

Feragatname
Bilgiler ve yayınlar, TradingView tarafından sağlanan veya onaylanan finansal, yatırım, alım satım veya diğer türden tavsiye veya öneriler anlamına gelmez ve teşkil etmez. Kullanım Koşulları bölümünde daha fazlasını okuyun.
Feragatname
Bilgiler ve yayınlar, TradingView tarafından sağlanan veya onaylanan finansal, yatırım, alım satım veya diğer türden tavsiye veya öneriler anlamına gelmez ve teşkil etmez. Kullanım Koşulları bölümünde daha fazlasını okuyun.