OPEN-SOURCE SCRIPT
nichoxbt's NUPL ratio
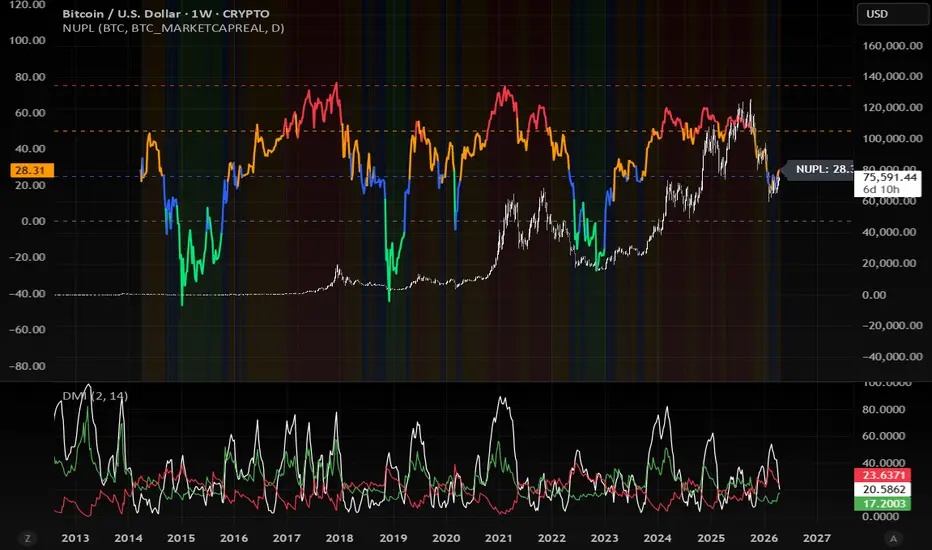
BTC NUPL (Net Unrealized Profit/Loss) is an on-chain indicator that measures the overall profitability of Bitcoin holders by comparing Market Cap and Realized Cap.
It provides a clear view of market cycles by showing whether investors are, on average, in profit or loss — making it a powerful tool for identifying long-term tops and bottoms.
NUPL is calculated as:
- Market Cap → current value of all BTC
- Realized Cap → aggregate cost basis of all BTC
By comparing the two, the indicator reveals the level of unrealized profit in the market.
Explanation:
- Green = Capitulation/Pain zone, perfect for accumulating because macro bottom is likely to form
- Blue = Hope/Slow recovery, good for accumulating since its not likely to bottom yet
- Orange = Belief/Growth, start scalling out slowly because macro top is near
- Red = Euphoria/Greed, its highly recommended to take profits because macro top is likely to form
Conclusion:
Green, Blue = Buy (Bear market bottom)
Orange, Red = Sell (Bull market top)
Important Notes
This is a macro-level indicator, not designed for short-term trading signals
Best used for cycle analysis and long-term positioning
Works strongest when combined with other tools and market context
It provides a clear view of market cycles by showing whether investors are, on average, in profit or loss — making it a powerful tool for identifying long-term tops and bottoms.
NUPL is calculated as:
- Market Cap → current value of all BTC
- Realized Cap → aggregate cost basis of all BTC
By comparing the two, the indicator reveals the level of unrealized profit in the market.
Explanation:
- Green = Capitulation/Pain zone, perfect for accumulating because macro bottom is likely to form
- Blue = Hope/Slow recovery, good for accumulating since its not likely to bottom yet
- Orange = Belief/Growth, start scalling out slowly because macro top is near
- Red = Euphoria/Greed, its highly recommended to take profits because macro top is likely to form
Conclusion:
Green, Blue = Buy (Bear market bottom)
Orange, Red = Sell (Bull market top)
Important Notes
This is a macro-level indicator, not designed for short-term trading signals
Best used for cycle analysis and long-term positioning
Works strongest when combined with other tools and market context
Açık kaynak kodlu komut dosyası
Gerçek TradingView ruhuyla, bu komut dosyasının mimarı, yatırımcıların işlevselliğini inceleyip doğrulayabilmesi için onu açık kaynaklı hale getirdi. Yazarı tebrik ederiz! Ücretsiz olarak kullanabilseniz de, kodu yeniden yayınlamanın Topluluk Kurallarımıza tabi olduğunu unutmayın.

Feragatname
Bilgiler ve yayınlar, TradingView tarafından sağlanan veya onaylanan finansal, yatırım, alım satım veya diğer türden tavsiye veya öneriler anlamına gelmez ve teşkil etmez. Kullanım Koşulları bölümünde daha fazlasını okuyun.
Açık kaynak kodlu komut dosyası
Gerçek TradingView ruhuyla, bu komut dosyasının mimarı, yatırımcıların işlevselliğini inceleyip doğrulayabilmesi için onu açık kaynaklı hale getirdi. Yazarı tebrik ederiz! Ücretsiz olarak kullanabilseniz de, kodu yeniden yayınlamanın Topluluk Kurallarımıza tabi olduğunu unutmayın.
Feragatname
Bilgiler ve yayınlar, TradingView tarafından sağlanan veya onaylanan finansal, yatırım, alım satım veya diğer türden tavsiye veya öneriler anlamına gelmez ve teşkil etmez. Kullanım Koşulları bölümünde daha fazlasını okuyun.