OPEN-SOURCE SCRIPT
Elaris Candle Liquidity POC Pro
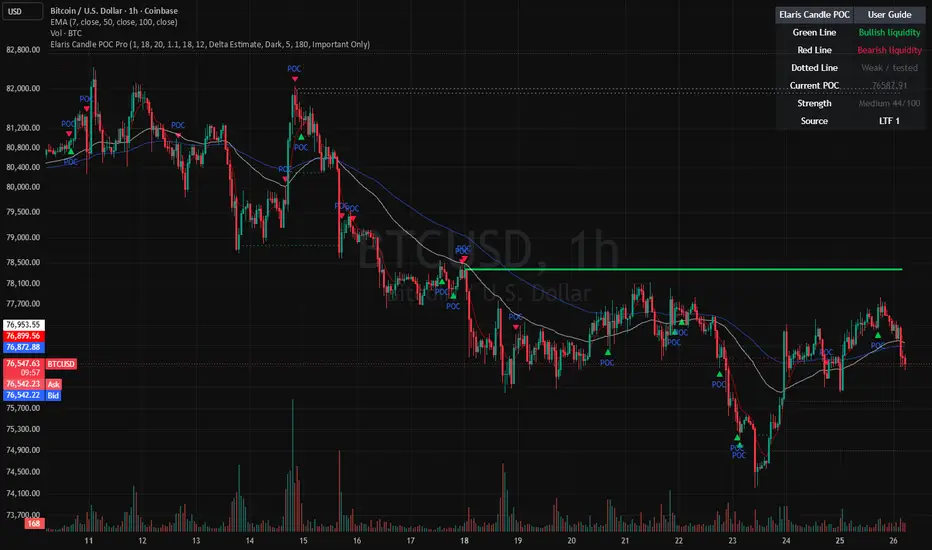
# Elaris Candle Liquidity POC Pro
Elaris Candle Liquidity POC Pro is an advanced candle-level liquidity and volume concentration indicator designed to help traders identify where the market executed the highest amount of activity inside individual candles.
Instead of treating a candle as a single price bar, the indicator analyzes internal price distribution and estimates where the majority of trading volume was concentrated. These liquidity concentration levels are displayed directly on the chart as clean bullish and bearish POC (Point of Control) levels.
The result is a lightweight micro-volume profiling system that helps traders visualize:
• High-interest liquidity prices
• Strong reaction levels
• Potential support and resistance areas
• Untested liquidity zones
• Retest opportunities
• Aggressive buying and selling pressure inside candles
The indicator uses optional lower timeframe precision to improve internal candle analysis while remaining optimized for real-time chart performance.
━━━━━━━━━━━━━━━━━━
FEATURES
━━━━━━━━━━━━━━━━━━
• Candle-Level Liquidity Profiling
Analyzes each candle internally to estimate the most active traded price zone.
• Bullish & Bearish Liquidity Detection
Green levels highlight bullish liquidity concentration while red levels highlight bearish concentration.
• Untested Liquidity Tracking
Important liquidity levels can extend forward until price revisits and tests them.
• Liquidity Retest Signals
Optional retest markers appear when price revisits strong liquidity zones.
• Strength Scoring System
Each liquidity level is scored using concentration and relative volume strength.
• Lower Timeframe Precision Mode
Uses lower timeframe candles to improve volume distribution estimation inside each candle.
• Smart Filtering
Reduce noise by filtering weak liquidity candles and focusing on stronger institutional-style activity.
• Liquidity Zones
Optional shaded micro-zones help visualize reaction areas around major POCs.
• Built-In Dashboard
Simple dashboard and legend help users understand current liquidity conditions directly on chart.
━━━━━━━━━━━━━━━━━━
HOW TO USE
━━━━━━━━━━━━━━━━━━
• Strong bullish liquidity levels may act as support or accumulation zones.
• Strong bearish liquidity levels may act as resistance or distribution zones.
• Untested levels can remain important until price revisits them.
• Retest signals may help identify continuation or rejection opportunities after liquidity interaction.
• Higher concentration percentages often indicate stronger market participation at a specific price level.
This tool is designed to complement price action, structure analysis, and risk management — not replace them.
━━━━━━━━━━━━━━━━━━
NON-REPAINTING
━━━━━━━━━━━━━━━━━━
This indicator is designed to be non-repainting.
Liquidity levels are only confirmed and plotted after candle close.
━━━━━━━━━━━━━━━━━━
IMPORTANT NOTES
━━━━━━━━━━━━━━━━━━
• Internal volume distribution is estimated using available chart and lower timeframe data.
• Lower timeframe precision depends on TradingView data availability.
• This indicator does not predict future price direction.
• No indicator guarantees profitable trades or future performance. Always use proper risk management and personal confirmation before entering trades.
━━━━━━━━━━━━━━━━━━
BEST USE CASES
━━━━━━━━━━━━━━━━━━
• Crypto Futures
• Scalping
• Intraday Trading
• Liquidity-Based Trading
• Price Action Trading
• Volume Analysis
• Support & Resistance Mapping
• Session Trading
Elaris Candle Liquidity POC Pro is an advanced candle-level liquidity and volume concentration indicator designed to help traders identify where the market executed the highest amount of activity inside individual candles.
Instead of treating a candle as a single price bar, the indicator analyzes internal price distribution and estimates where the majority of trading volume was concentrated. These liquidity concentration levels are displayed directly on the chart as clean bullish and bearish POC (Point of Control) levels.
The result is a lightweight micro-volume profiling system that helps traders visualize:
• High-interest liquidity prices
• Strong reaction levels
• Potential support and resistance areas
• Untested liquidity zones
• Retest opportunities
• Aggressive buying and selling pressure inside candles
The indicator uses optional lower timeframe precision to improve internal candle analysis while remaining optimized for real-time chart performance.
━━━━━━━━━━━━━━━━━━
FEATURES
━━━━━━━━━━━━━━━━━━
• Candle-Level Liquidity Profiling
Analyzes each candle internally to estimate the most active traded price zone.
• Bullish & Bearish Liquidity Detection
Green levels highlight bullish liquidity concentration while red levels highlight bearish concentration.
• Untested Liquidity Tracking
Important liquidity levels can extend forward until price revisits and tests them.
• Liquidity Retest Signals
Optional retest markers appear when price revisits strong liquidity zones.
• Strength Scoring System
Each liquidity level is scored using concentration and relative volume strength.
• Lower Timeframe Precision Mode
Uses lower timeframe candles to improve volume distribution estimation inside each candle.
• Smart Filtering
Reduce noise by filtering weak liquidity candles and focusing on stronger institutional-style activity.
• Liquidity Zones
Optional shaded micro-zones help visualize reaction areas around major POCs.
• Built-In Dashboard
Simple dashboard and legend help users understand current liquidity conditions directly on chart.
━━━━━━━━━━━━━━━━━━
HOW TO USE
━━━━━━━━━━━━━━━━━━
• Strong bullish liquidity levels may act as support or accumulation zones.
• Strong bearish liquidity levels may act as resistance or distribution zones.
• Untested levels can remain important until price revisits them.
• Retest signals may help identify continuation or rejection opportunities after liquidity interaction.
• Higher concentration percentages often indicate stronger market participation at a specific price level.
This tool is designed to complement price action, structure analysis, and risk management — not replace them.
━━━━━━━━━━━━━━━━━━
NON-REPAINTING
━━━━━━━━━━━━━━━━━━
This indicator is designed to be non-repainting.
Liquidity levels are only confirmed and plotted after candle close.
━━━━━━━━━━━━━━━━━━
IMPORTANT NOTES
━━━━━━━━━━━━━━━━━━
• Internal volume distribution is estimated using available chart and lower timeframe data.
• Lower timeframe precision depends on TradingView data availability.
• This indicator does not predict future price direction.
• No indicator guarantees profitable trades or future performance. Always use proper risk management and personal confirmation before entering trades.
━━━━━━━━━━━━━━━━━━
BEST USE CASES
━━━━━━━━━━━━━━━━━━
• Crypto Futures
• Scalping
• Intraday Trading
• Liquidity-Based Trading
• Price Action Trading
• Volume Analysis
• Support & Resistance Mapping
• Session Trading
Açık kaynak kodlu komut dosyası
Gerçek TradingView ruhuyla, bu komut dosyasının mimarı, yatırımcıların işlevselliğini inceleyip doğrulayabilmesi için onu açık kaynaklı hale getirdi. Yazarı tebrik ederiz! Ücretsiz olarak kullanabilseniz de, kodu yeniden yayınlamanın Topluluk Kurallarımıza tabi olduğunu unutmayın.

Feragatname
Bilgiler ve yayınlar, TradingView tarafından sağlanan veya onaylanan finansal, yatırım, alım satım veya diğer türden tavsiye veya öneriler anlamına gelmez ve teşkil etmez. Kullanım Koşulları bölümünde daha fazlasını okuyun.
Açık kaynak kodlu komut dosyası
Gerçek TradingView ruhuyla, bu komut dosyasının mimarı, yatırımcıların işlevselliğini inceleyip doğrulayabilmesi için onu açık kaynaklı hale getirdi. Yazarı tebrik ederiz! Ücretsiz olarak kullanabilseniz de, kodu yeniden yayınlamanın Topluluk Kurallarımıza tabi olduğunu unutmayın.
Feragatname
Bilgiler ve yayınlar, TradingView tarafından sağlanan veya onaylanan finansal, yatırım, alım satım veya diğer türden tavsiye veya öneriler anlamına gelmez ve teşkil etmez. Kullanım Koşulları bölümünde daha fazlasını okuyun.