Güncellendi
Hall Lag Line Oscillator
█ OVERVIEW
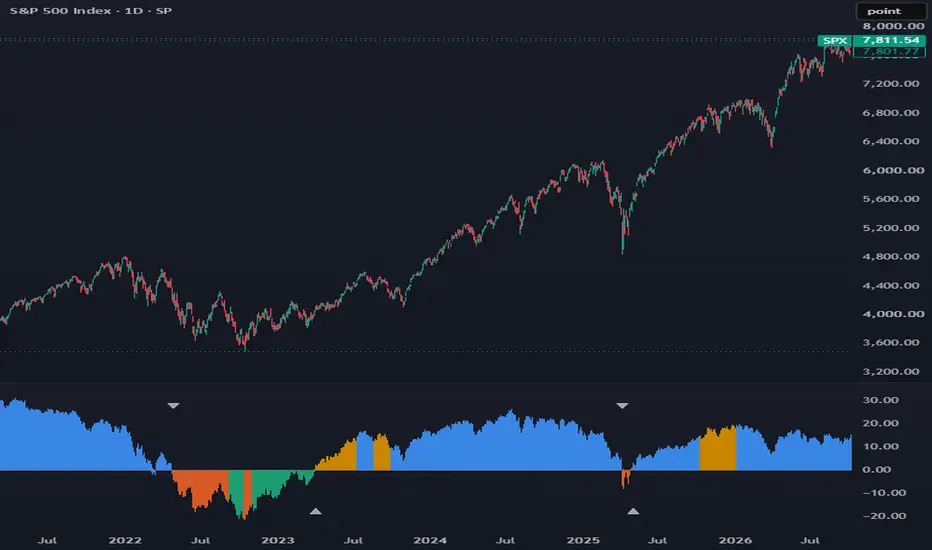
Hall Lag Line Oscillator plots, in its own pane, the percent distance between price and Alan Hall's lag line, a six-month average of price moved six months forward. Each column is colored by one of four states that combine where price sits relative to the line with the direction the line is moving. Small triangles mark the bars on which price closes beyond the line by more than a set band after being on the other side of it.
Thesis: stock prices register a change in collective mood first and economic and political news follows months later, so the distance between price and a delayed average of price shows how far mood has moved ahead of the news.
█ HISTORY / BACKGROUND
The lag line comes from Alan Hall, chapter 8 of The Socionomic Theory of Finance by Robert R. Prechter (2016). Hall defines it as a six-month moving average of a major U.S. stock average, shifted six months into the future. He presents it as an estimate of when lagging expressions of social mood, such as economic and political news, will turn. He reports that at major extremes over the past century it turned roughly nine months after stock prices, and he describes it as the approximate center of a broad band of probability, not an exact timing line.
The conceptual basis is socionomic theory. In that framework social mood is the independent variable. Stock prices register a change in mood first, because a trade can be placed at once. Economic statistics and political events express the same mood later, because the actions behind them take longer to carry out. A.J. Frost and Robert Prechter make a related point in Elliott Wave Principle: the news tends to trail the market by a wave or two.
Hall does not specify the type of average or the data frequency, and he gives no rules for states or signals. The calendar-month construction, the four states, the hysteresis bands, the cross markers and the scheduled turn readout are original to this script.
█ HOW IT WORKS
The script uses only the chart's own bars. It makes no higher-timeframe requests.
1. Calendar months. A helper moves any bar time forward or back by whole calendar months in the exchange time zone and keeps the time of day. When the target month is shorter, the day is clamped to that month's last day, so August 31 minus six months is February 28 or 29.
2. Trailing average. For each bar, the script averages every close whose bar time falls after the point Average window months earlier, up to and including the current bar. A running sum over a queue keeps this efficient. The average is reported only once the loaded history reaches back past the start of the window.
3. Lag line. The lag line at a bar is the trailing average as of the last bar at or before the point Forward shift months earlier. A second queue returns the same quantity one month further back, which is the line's value one month ago.
4. Gap. Gap = 100 × (close ÷ lag line - 1). The columns plot this value.
5. Line slope. Slope = 100 × (lag line ÷ lag line one month earlier - 1), in percent per month.
6. Position, with hysteresis. Position starts as above or below from the sign of the gap. It switches to below only when the gap falls under minus Price band, and back to above only when the gap rises over plus Price band.
7. Direction, with hysteresis. Direction starts as rising or falling from the sign of the slope. It switches to falling only when the slope falls under minus Slope band, and back to rising only when the slope rises over plus Slope band.
8. State. Above and rising is state 1. Below and rising is state 2. Below and falling is state 3. Above and falling is state 4.
9. Crosses. An up cross is a confirmed bar on which position switches from below to above. A down cross is a confirmed bar on which it switches from above to below. The check uses `barstate.isconfirmed`.
10. Scheduled turn. Every line value is an average of closes at least Forward shift months old, so the next Forward shift months of the line are already set by existing bars. On the last bar the script walks those coming values and reports the first date on which the one-month change would pass the slope band in the opposite direction. This feeds the status table.
█ HOW TO USE
Where to use it. Use it on major stock indexes and sector ETFs. The method reads price as a gauge of crowd mood. An index or a sector fund averages many companies, so company-specific events cancel out. On a single stock the script still runs, but the line then trails company news such as earnings, and the four states lose the meaning described here.
Which timeframe. Use the daily chart. The script is built for daily, weekly and monthly charts and refuses intraday charts, because its windows are measured in months. The windows are calendar months, not bar counts, so the line is nearly the same on all three timeframes. The daily chart is recommended because a daily close is the first to confirm a cross. Weekly is the fallback if daily crosses flip back and forth near the band.
Reading the columns. The solid zero line is the lag line. A column above zero means price is above the line, and its height is the distance in percent. A column below zero means price is under the line. The dotted lines mark the price band on each side.
Reading the colors.
• Blue, state 1. Price is above the line and the line is rising. Mood and the lagging news agree on the upside.
• Orange, state 2. Price is below the line and the line is still rising. Price has turned down while the news gauge is still rising, so good news in this phase is the lagging echo of the earlier advance.
• Green, state 3. Price is below the line and the line is falling. Mood and the lagging news agree on the downside.
• Gold, state 4. Price is above the line and the line is still falling. Price has turned up while the news gauge is still falling, so bad news in this phase is the lagging echo of the earlier decline.
• Gray. Not enough history yet.
The states usually run in the order 1, 2, 3, 4 and back to 1. When orange goes straight back to blue, the decline was too short to turn the line.
Reading the triangles. An up triangle at the bottom of the pane marks a close more than the price band above the line after a spell below it. A down triangle at the top marks a close more than the price band below the line after a spell above it. Both print only when the bar closes.
Bottoms and tops. The indicator is more useful at the end of declines than at the end of advances. Both kinds of cross arrive some months after the turn in price, by construction. Declines are usually shorter and faster than advances, so the same delay uses up a larger share of a decline than of the advance that follows it. Read an up triangle as the indicator's confirmation that a decline has ended. Read a down triangle as late confirmation that a decline is under way, not as a top signal.
Status table. The table is off by default. When it is on, it shows the current state, the date that state began, the current gap, the line's direction, and the next scheduled change in the line's direction within the next Forward shift months.
Alerts. Six alert conditions are available: Up cross, Down cross, State 1, State 2, State 3 and State 4.
█ SETTINGS
• Average window (months). Default 6, range 1 to 24. Sets the length of the trailing calendar window that is averaged.
• Forward shift (months). Default 6, range 1 to 24. Sets how far forward the average is moved. It also sets how far ahead the status table looks for a line turn.
• Price band (%). Default 2.0. Sets how far beyond the line price must close to switch position and print a triangle. It also places the two dotted lines.
• Slope band (% per month). Default 0.25. Sets how much the line must change over one month to switch direction.
• Show status table. Default off.
• Show cross markers. Default on.
█ WHAT MAKES IT ORIGINAL
Hall published the lag line as a chart overlay and a reading aid. He gave no oscillator, no states and no rules. This script differs in five ways.
• It measures both the averaging window and the forward shift in calendar months in the exchange time zone, not in bar counts. The line is therefore close to identical on daily, weekly and monthly charts, and holidays or changes in the number of trading days do not shorten the window.
• It turns the line into an oscillator of percent distance, so the gap between mood and lagging news reads as a number.
• It classifies every bar into one of four states from two separate tests, price position and line direction, each with its own hysteresis band. The two divergent states put Hall's idea that news lags mood into explicit terms that can be checked against events.
• It uses the fact that the line is built from past closes. The next Forward shift months of the line are already set, and the script reports the next scheduled change in the line's direction.
• It marks band crosses on confirmed bars only.
█ NOTES / LIMITATIONS
• Timeframes. Daily, weekly and monthly only. On an intraday chart the script stops with an error message.
• History. The gap needs Average window plus Forward shift months of loaded history, 12 months by default, and the states need one month more. Until then the columns are gray or absent. A symbol with less history shows no states.
• Built-in delay. Every value of the line is an average of closes at least Forward shift months old. With the defaults the line typically turns six to ten months after a price extreme, mostly because of the averaging and the shift, and both kinds of cross occur after the turn in price.
• Open bar. The script makes no higher-timeframe requests and uses no lookahead. Lag line values come from closed bars and do not change. On the open bar, the column height, its color and the state follow the live price and can change before the close. The scheduled turn date in the table can also change, because its newest value includes the live close. Triangles and the Up cross and Down cross alerts wait for the bar to close. The State alerts can fire during the bar, so set them to trigger once per bar close.
• Forward window. The status table looks only Forward shift months ahead. "None before" a date means no turn inside that window, not that none follows.
• Symbol type. The code does not check symbol type. The interpretation in this description assumes a broad index or a sector ETF. A single stock can also gap through the band on one company report.
• Calendar rules. Month shifts use the exchange time zone and clamp to the last day of shorter months.
Hall Lag Line Oscillator plots, in its own pane, the percent distance between price and Alan Hall's lag line, a six-month average of price moved six months forward. Each column is colored by one of four states that combine where price sits relative to the line with the direction the line is moving. Small triangles mark the bars on which price closes beyond the line by more than a set band after being on the other side of it.
Thesis: stock prices register a change in collective mood first and economic and political news follows months later, so the distance between price and a delayed average of price shows how far mood has moved ahead of the news.
█ HISTORY / BACKGROUND
The lag line comes from Alan Hall, chapter 8 of The Socionomic Theory of Finance by Robert R. Prechter (2016). Hall defines it as a six-month moving average of a major U.S. stock average, shifted six months into the future. He presents it as an estimate of when lagging expressions of social mood, such as economic and political news, will turn. He reports that at major extremes over the past century it turned roughly nine months after stock prices, and he describes it as the approximate center of a broad band of probability, not an exact timing line.
The conceptual basis is socionomic theory. In that framework social mood is the independent variable. Stock prices register a change in mood first, because a trade can be placed at once. Economic statistics and political events express the same mood later, because the actions behind them take longer to carry out. A.J. Frost and Robert Prechter make a related point in Elliott Wave Principle: the news tends to trail the market by a wave or two.
Hall does not specify the type of average or the data frequency, and he gives no rules for states or signals. The calendar-month construction, the four states, the hysteresis bands, the cross markers and the scheduled turn readout are original to this script.
█ HOW IT WORKS
The script uses only the chart's own bars. It makes no higher-timeframe requests.
1. Calendar months. A helper moves any bar time forward or back by whole calendar months in the exchange time zone and keeps the time of day. When the target month is shorter, the day is clamped to that month's last day, so August 31 minus six months is February 28 or 29.
2. Trailing average. For each bar, the script averages every close whose bar time falls after the point Average window months earlier, up to and including the current bar. A running sum over a queue keeps this efficient. The average is reported only once the loaded history reaches back past the start of the window.
3. Lag line. The lag line at a bar is the trailing average as of the last bar at or before the point Forward shift months earlier. A second queue returns the same quantity one month further back, which is the line's value one month ago.
4. Gap. Gap = 100 × (close ÷ lag line - 1). The columns plot this value.
5. Line slope. Slope = 100 × (lag line ÷ lag line one month earlier - 1), in percent per month.
6. Position, with hysteresis. Position starts as above or below from the sign of the gap. It switches to below only when the gap falls under minus Price band, and back to above only when the gap rises over plus Price band.
7. Direction, with hysteresis. Direction starts as rising or falling from the sign of the slope. It switches to falling only when the slope falls under minus Slope band, and back to rising only when the slope rises over plus Slope band.
8. State. Above and rising is state 1. Below and rising is state 2. Below and falling is state 3. Above and falling is state 4.
9. Crosses. An up cross is a confirmed bar on which position switches from below to above. A down cross is a confirmed bar on which it switches from above to below. The check uses `barstate.isconfirmed`.
10. Scheduled turn. Every line value is an average of closes at least Forward shift months old, so the next Forward shift months of the line are already set by existing bars. On the last bar the script walks those coming values and reports the first date on which the one-month change would pass the slope band in the opposite direction. This feeds the status table.
█ HOW TO USE
Where to use it. Use it on major stock indexes and sector ETFs. The method reads price as a gauge of crowd mood. An index or a sector fund averages many companies, so company-specific events cancel out. On a single stock the script still runs, but the line then trails company news such as earnings, and the four states lose the meaning described here.
Which timeframe. Use the daily chart. The script is built for daily, weekly and monthly charts and refuses intraday charts, because its windows are measured in months. The windows are calendar months, not bar counts, so the line is nearly the same on all three timeframes. The daily chart is recommended because a daily close is the first to confirm a cross. Weekly is the fallback if daily crosses flip back and forth near the band.
Reading the columns. The solid zero line is the lag line. A column above zero means price is above the line, and its height is the distance in percent. A column below zero means price is under the line. The dotted lines mark the price band on each side.
Reading the colors.
• Blue, state 1. Price is above the line and the line is rising. Mood and the lagging news agree on the upside.
• Orange, state 2. Price is below the line and the line is still rising. Price has turned down while the news gauge is still rising, so good news in this phase is the lagging echo of the earlier advance.
• Green, state 3. Price is below the line and the line is falling. Mood and the lagging news agree on the downside.
• Gold, state 4. Price is above the line and the line is still falling. Price has turned up while the news gauge is still falling, so bad news in this phase is the lagging echo of the earlier decline.
• Gray. Not enough history yet.
The states usually run in the order 1, 2, 3, 4 and back to 1. When orange goes straight back to blue, the decline was too short to turn the line.
Reading the triangles. An up triangle at the bottom of the pane marks a close more than the price band above the line after a spell below it. A down triangle at the top marks a close more than the price band below the line after a spell above it. Both print only when the bar closes.
Bottoms and tops. The indicator is more useful at the end of declines than at the end of advances. Both kinds of cross arrive some months after the turn in price, by construction. Declines are usually shorter and faster than advances, so the same delay uses up a larger share of a decline than of the advance that follows it. Read an up triangle as the indicator's confirmation that a decline has ended. Read a down triangle as late confirmation that a decline is under way, not as a top signal.
Status table. The table is off by default. When it is on, it shows the current state, the date that state began, the current gap, the line's direction, and the next scheduled change in the line's direction within the next Forward shift months.
Alerts. Six alert conditions are available: Up cross, Down cross, State 1, State 2, State 3 and State 4.
█ SETTINGS
• Average window (months). Default 6, range 1 to 24. Sets the length of the trailing calendar window that is averaged.
• Forward shift (months). Default 6, range 1 to 24. Sets how far forward the average is moved. It also sets how far ahead the status table looks for a line turn.
• Price band (%). Default 2.0. Sets how far beyond the line price must close to switch position and print a triangle. It also places the two dotted lines.
• Slope band (% per month). Default 0.25. Sets how much the line must change over one month to switch direction.
• Show status table. Default off.
• Show cross markers. Default on.
█ WHAT MAKES IT ORIGINAL
Hall published the lag line as a chart overlay and a reading aid. He gave no oscillator, no states and no rules. This script differs in five ways.
• It measures both the averaging window and the forward shift in calendar months in the exchange time zone, not in bar counts. The line is therefore close to identical on daily, weekly and monthly charts, and holidays or changes in the number of trading days do not shorten the window.
• It turns the line into an oscillator of percent distance, so the gap between mood and lagging news reads as a number.
• It classifies every bar into one of four states from two separate tests, price position and line direction, each with its own hysteresis band. The two divergent states put Hall's idea that news lags mood into explicit terms that can be checked against events.
• It uses the fact that the line is built from past closes. The next Forward shift months of the line are already set, and the script reports the next scheduled change in the line's direction.
• It marks band crosses on confirmed bars only.
█ NOTES / LIMITATIONS
• Timeframes. Daily, weekly and monthly only. On an intraday chart the script stops with an error message.
• History. The gap needs Average window plus Forward shift months of loaded history, 12 months by default, and the states need one month more. Until then the columns are gray or absent. A symbol with less history shows no states.
• Built-in delay. Every value of the line is an average of closes at least Forward shift months old. With the defaults the line typically turns six to ten months after a price extreme, mostly because of the averaging and the shift, and both kinds of cross occur after the turn in price.
• Open bar. The script makes no higher-timeframe requests and uses no lookahead. Lag line values come from closed bars and do not change. On the open bar, the column height, its color and the state follow the live price and can change before the close. The scheduled turn date in the table can also change, because its newest value includes the live close. Triangles and the Up cross and Down cross alerts wait for the bar to close. The State alerts can fire during the bar, so set them to trigger once per bar close.
• Forward window. The status table looks only Forward shift months ahead. "None before" a date means no turn inside that window, not that none follows.
• Symbol type. The code does not check symbol type. The interpretation in this description assumes a broad index or a sector ETF. A single stock can also gap through the band on one company report.
• Calendar rules. Month shifts use the exchange time zone and clamp to the last day of shorter months.
Sürüm Notları
Price band default raised from 2.0% to 3.0%. On daily charts the 2% band let price cross back and forth near the line within weeks. 3% removes most of those crosses and keeps the timing of the first cross after major turns.State 1 to State 4 alerts now fire only at the bar close, the same as the Up cross and Down cross alerts.
Added two alerts, Line turns up and Line turns down. Each fires at the bar close when the lag line's one-month change passes the slope band in the opposite direction.

Feragatname
Bilgiler ve yayınlar, TradingView tarafından sağlanan veya onaylanan finansal, yatırım, alım satım veya diğer türden tavsiye veya öneriler anlamına gelmez ve teşkil etmez. Kullanım Koşulları bölümünde daha fazlasını okuyun.
Feragatname
Bilgiler ve yayınlar, TradingView tarafından sağlanan veya onaylanan finansal, yatırım, alım satım veya diğer türden tavsiye veya öneriler anlamına gelmez ve teşkil etmez. Kullanım Koşulları bölümünde daha fazlasını okuyun.