Güncellendi
BTC Golden Bottom with Adaptive Moving Average
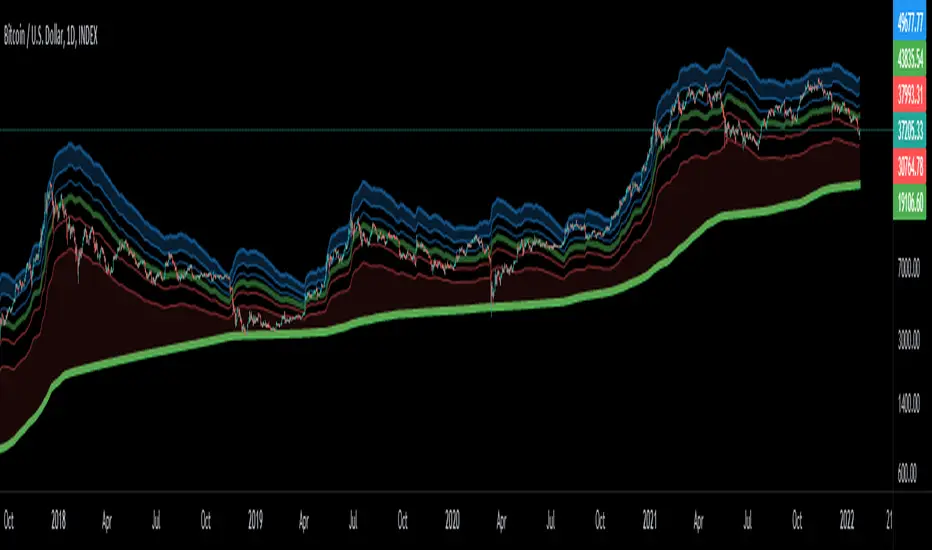
Introduction:
This study uses Adaptive Moving Average with 1 year of length to plot on BTCUSD all time history Index Calculated by Tradingview. All previous BTC bear runs bottomed on this curve which makes it important enough. Use this only on "BTCUSD"
Default Values:
This study uses Adaptive Moving Average with 1 year of length to plot on
BTCUSD all time history Index Calculated by Tradingview. All previous BTC bear runs bottomed on this curve which makes it important enough. Use this only on "BTCUSD"Default Values:
- AMA length is 1 year
- Minor length is 50
- Major length is 100
Sürüm Notları
Added Envelop Bands with ATR multiples of Fibonacci levels for in depth status of present data depending on past history.Sürüm Notları
Updated Envelope bands code with Color.rgb and applied Symmetrically Weighted Moving Average (SWMA) for Smoothness.
Feragatname
Bilgiler ve yayınlar, TradingView tarafından sağlanan veya onaylanan finansal, yatırım, alım satım veya diğer türden tavsiye veya öneriler anlamına gelmez ve teşkil etmez. Kullanım Koşulları bölümünde daha fazlasını okuyun.
Feragatname
Bilgiler ve yayınlar, TradingView tarafından sağlanan veya onaylanan finansal, yatırım, alım satım veya diğer türden tavsiye veya öneriler anlamına gelmez ve teşkil etmez. Kullanım Koşulları bölümünde daha fazlasını okuyun.