Morning Star & Evening Star - Pullback Confirmation System
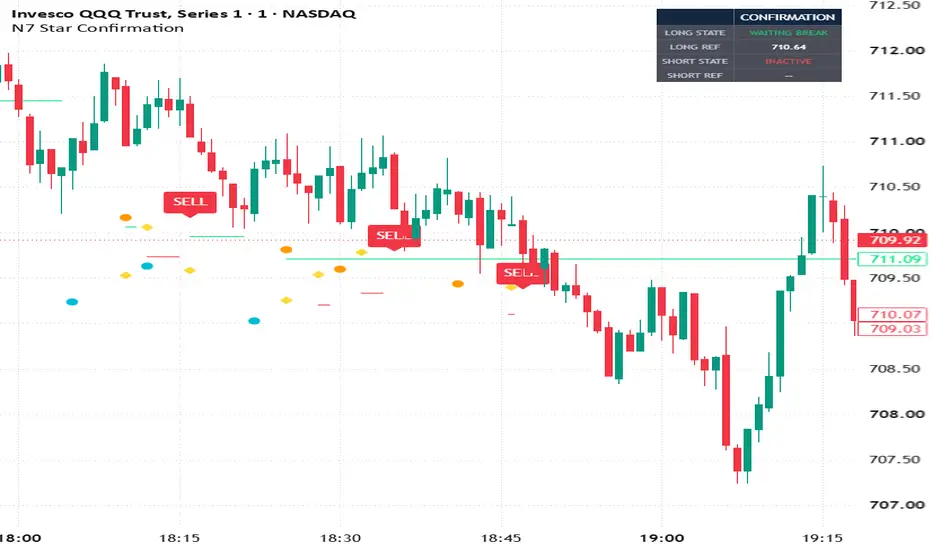
#Morning Star & Evening Star – Pullback Confirmation System#
### Overview
Morning Star and Evening Star are two classic candlestick reversal patterns widely used in technical analysis. Traditional interpretations generally focus on the strength of the third candle, assuming that a larger candle body and increased trading volume indicate a stronger reversal signal.
However, a strong reversal candle does not necessarily provide an ideal entry point, particularly in short-term Day Trading.
After a sharp upward movement, aggressive buying may begin to weaken, while some short-term traders start taking profits. This can create fresh selling pressure, causing prices to pull back even after a seemingly strong Morning Star pattern.
The same principle can apply in reverse to Evening Star patterns.
This indicator introduces a different approach to analyzing these traditional candlestick formations.
*Instead of generating an immediate entry signal when a Morning Star or Evening Star is completed, the indicator waits for a specific pullback structure and requires a subsequent price breakout before confirming a BUY or SELL signal.*
The objective is to examine whether the original reversal direction can reassert itself after an additional round of opposing price movement.
### 1. Morning Star Detection
The indicator identifies a Morning Star using three consecutive candlesticks.
The following conditions must be satisfied:
1. The first candle must be bearish.
2. The second candle must have a relatively small real body, less than 50% of the first candle's body.
3. The third candle must be bullish.
4. The third candle must close above the midpoint of the first candle's real body.
Once these conditions are satisfied, the Morning Star is identified.
However, the indicator does not immediately generate a BUY signal.
Instead, it enters a reference-candle detection stage.
### 2. Morning Star – Pullback and BUY Confirmation
After detecting a Morning Star, the indicator searches for the first subsequent bearish candle meeting two conditions:
- The candle must close below its opening price.
- Its low must fall below the previous candle's low.
This candle becomes the bullish setup's reference candle.
The indicator records its highest price as the reference level.
A BUY signal is generated only when a subsequent candle trades above this reference high.
The rationale is that the initial bullish reversal may attract short-term profit-taking. Waiting for a qualifying bearish pullback candle allows the indicator to observe an additional downward price movement before considering an entry.
If buyers subsequently push prices above the reference candle's high, this may indicate that buying pressure is reasserting itself.
Rather than immediately chasing the third bullish candle of a Morning Star, the indicator requires a second price-based confirmation.
### 3. Evening Star – Pullback and SELL Confirmation
The Evening Star follows the opposite logic.
The pattern is identified when:
1. The first candle is bullish.
2. The second candle's real body is smaller than 50% of the first candle's body.
3. The third candle is bearish.
4. The third candle closes below the midpoint of the first candle's real body.
After detecting an Evening Star, the indicator searches for the first subsequent bullish candle whose high exceeds the previous candle's high.
The low of this bullish reference candle becomes the critical reference price.
A SELL signal is generated only when a later candle trades below that reference low.
This confirmation attempts to identify situations where an initial bearish reversal is followed by an upward correction, after which sellers regain short-term control.
### 4. The Market Microstructure Concept Behind the Indicator
The underlying research concept is inspired by the relationship between candlestick formations, short-term price action, and Level 2 market depth.
Consider a Morning Star pattern.
During the third bullish candle, aggressive buyers may repeatedly execute trades at the Ask, consuming available sell orders and driving prices higher.
As buying continues, liquidity at nearby Ask levels may temporarily decline, allowing prices to move upward rapidly.
However, after this bullish candle is completed, additional sell orders may appear at higher price levels.
Some short-term traders who entered during the initial advance may also begin taking profits.
Consequently, a strong bullish candle does not necessarily guarantee further upward movement.
A temporary pullback may develop even when the original reversal pattern appears convincing.
This indicator uses a price-based confirmation process to examine what happens after that initial move.
First, it waits for a bearish candle that breaks the previous candle's low.
Then, it monitors whether prices can recover and break above the bearish reference candle's high.
*The key concept is that the strength of the initial reversal and the quality of the subsequent entry point are two different considerations.*
The indicator applies the same concept in reverse to Evening Star patterns.
Level 2 order-book behavior provides the theoretical explanation for this approach. However, the indicator itself does not directly access Level 2 data, order flow, or market-depth information.
All signals are calculated using candlestick price data.
### 5. Indicator Features
*Automatic Pattern Recognition*
The indicator automatically identifies Morning Star and Evening Star patterns based on predefined candlestick conditions.
*Reference Candle Detection*
After identifying a reversal pattern, the indicator searches for the first qualifying pullback candle and records its relevant high or low.
*Breakout Confirmation*
BUY and SELL signals are generated only after prices subsequently break the reference candle's designated level.
*Dynamic Reference Price Levels*
The indicator displays the reference price while the corresponding setup is waiting for breakout confirmation.
*Customizable Chart Visualization*
Users can independently enable or disable:
- Morning Star and Evening Star markers.
- Reference candle markers.
- BUY and SELL signal labels.
- Reference price levels.
Colors for the different signals and reference lines can also be customized.
*Status Dashboard*
The indicator includes an optional status dashboard showing the current confirmation stage for bullish and bearish setups.
The dashboard displays three possible states:
- *INACTIVE:* No active setup is currently being tracked in that direction.
- *WAITING REF:* A reversal pattern has been detected, and the indicator is waiting for a qualifying reference candle.
- *WAITING BREAK:* A qualifying reference candle has been identified, and the indicator is waiting for a breakout.
When a setup is waiting for breakout confirmation, the dashboard also displays its reference price.
The dashboard is informational only and does not affect the underlying signal calculations.
*Trading Alerts*
Alert conditions are available for BUY and SELL signals.
These alerts can be configured using TradingView's standard alert system.
### 6. How to Use the Indicator
Apply the indicator to a TradingView candlestick chart.
When a Morning Star is detected, a marker appears below the corresponding candle.
When an Evening Star is detected, a marker appears above the candle.
The indicator then searches for the qualifying reference candle.
Once a reference candle is found, its relevant high or low is tracked as the breakout level.
A BUY or SELL label appears when a subsequent candle breaches the corresponding reference level.
Signals are confirmed only after the breakout candle closes.
However, the breakout condition is evaluated using the candle's high or low. The closing price is not required to remain beyond the reference level.
The indicator can be used to research different instruments and chart timeframes, including intraday charts such as 1-minute and 5-minute intervals.
Users can also monitor the dashboard to understand which confirmation stage is currently active.
### 7. Design Philosophy
Many traditional candlestick strategies attempt to improve signal quality by adding additional technical indicators, moving averages, oscillators, or volatility filters.
This indicator adopts a different research approach.
Rather than introducing multiple unrelated technical conditions, it focuses on the sequence of price movements following a traditional reversal pattern.
The process can be summarized as:
*Reversal Pattern → Qualifying Pullback Candle → Reference Price → Breakout Confirmation*
This structure provides clearly defined and reproducible entry conditions.
The purpose is not to assume that a stronger Morning Star or Evening Star will always produce a better trade.
Instead, the indicator attempts to distinguish the initial reversal movement from a later potential entry opportunity.
### 8. Important Limitations
This indicator is intended for technical analysis, price-action research, and educational purposes.
It is not a complete automated trading strategy.
The indicator does not include automatic trade execution, stop-loss placement, take-profit management, or position sizing.
A breakout above or below a reference candle does not guarantee that the reversal will continue.
False signals may occur during volatile markets, sideways price movement, or sudden liquidity changes.
A setup's reference level remains active until its breakout condition is triggered or a new qualifying pattern resets that direction's tracking process. The current version does not impose a fixed expiration period.
The indicator does not directly analyze trading volume, Level 2 market depth, or order-flow imbalance.
Its signals have not been presented as having any guaranteed win rate or profitability.
Users should evaluate its behavior across different market environments, instruments, and timeframes, and apply appropriate risk-management procedures before using its signals in live trading.
---
## 中文說明(繁體中文)
### 指標簡介
早晨之星(Morning Star)及黃昏之星(Evening Star)是傳統技術分析中非常常見的陰陽燭反轉形態。
一般技術分析方法認為,早晨之星第三根陽燭的實體越長、成交量越大,代表買盤力量越強,反轉訊號亦越值得留意。
不過,筆者認為,在 Day Trading 中,一根非常強的反轉陽燭,並不一定代表這根 K 線完成後立即買入,就是最理想的入市位置。
當股價短時間內快速上升,主動買盤可能開始減弱,而部分已經獲利的短線交易者亦可能開始平倉,令市場重新出現沽壓。
因此,即使早晨之星第三根陽燭非常強,之後股價仍然可能先出現明顯回落。
黃昏之星亦可能出現相反的情況。
本指標採用一種與傳統技術分析不同的研究方法。
*不在早晨之星或黃昏之星完成後立即產生入市訊號,而是等待特定的回調 K 線出現,再利用後續價格突破確認 BUY 或 SELL。*
這個方法的核心,是研究市場在經歷一輪反方向價格移動後,原本的反轉方向能否重新取得優勢。
### 1. 早晨之星的判斷條件
程式首先尋找由三根 K 線組成的早晨之星。
必須符合以下條件:
1. 第一根 K 線是陰燭。
2. 第二根 K 線的實體較細,必須小於第一根陰燭實體的 50%。
3. 第三根 K 線是陽燭。
4. 第三根陽燭的收市價,必須高於第一根陰燭實體的中位數。
當這些條件全部成立,程式便確認出現早晨之星。
不過,這時候不會立即產生 BUY 訊號。
程式會進入下一個階段,開始尋找符合要求的基準陰燭。
### 2. 早晨之星:等待回調後的 BUY 訊號
當早晨之星出現後,程式會尋找隨後第一根同時符合以下條件的 K 線:
- 必須是陰燭,即收市價低於開市價。
- 最低價必須跌穿前一根 K 線的最低價。
找到這根陰燭後,程式便將它定義為基準陰燭,並記錄它的最高價。
這個最高價將成為重要的突破參考位置。
只有當後面的 K 線重新升穿這個最高價,程式才會產生 BUY 訊號。
這個做法的原因,是早晨之星第三根陽燭上升期間,可能已經有不少短線交易者入市。
當股價升至較高位置,部分投資者可能開始獲利平倉,導致價格回落。
如果市場在經歷這一輪回落後,買方仍然能夠將價格重新推高,甚至突破剛才基準陰燭的最高價,便可能代表買盤重新取得短期優勢。
相比在第三根大陽燭完成後立即追入,這個方法要求市場提供多一次價格確認。
### 3. 黃昏之星:等待反彈後的 SELL 訊號
黃昏之星使用完全相反的判斷邏輯。
首先,程式尋找以下形態:
1. 第一根 K 線是陽燭。
2. 第二根 K 線的實體小於第一根陽燭實體的 50%。
3. 第三根 K 線是陰燭。
4. 第三根陰燭的收市價,必須低於第一根陽燭實體的中位數。
當黃昏之星完成後,程式不會立即產生 SELL 訊號。
相反,程式會等待第一根最高價升穿前一根 K 線最高價的陽燭。
找到後,將這根陽燭的最低價記錄下來,作為沽空的參考位置。
當後面的 K 線重新跌穿這個最低價,才產生 SELL 訊號。
這個做法是希望觀察市場在經歷一次向上反彈後,賣方能否重新取得短期優勢。
### 4. 指標背後的 Level 2 盤路分析概念
這個指標的研究概念,來自對陰陽燭、價格路徑及 Level 2 市場深度的觀察。
以早晨之星作為例子。
當第三根陽燭形成期間,市場可能出現大量主動買盤,不斷以 Ask 價成交,逐步消化上方的賣盤掛單。
如果 Ask 一方的掛單被快速消化,而上方幾個價位的掛單相對薄弱,股價就可能在短時間內快速上升,形成一根實體相當長的陽燭。
不過,大家要留意,剛才有大量主動買盤,不代表之後仍然會有同樣強度的買盤。
當第三根陽燭完成後,原本被消化的 Ask 掛單,可能在較高價位重新出現。
另外,部分已經持有帳面利潤的 Day Trader 亦可能開始獲利平倉。
這些行為都可能令股價出現回落。
因此,*第三根陽燭的強度,與這根陽燭完成後是否值得立即買入,其實是兩個不同的問題。*
本指標會等待市場先出現一根跌穿前根低位的陰燭,再將這根陰燭的最高價作為重要參考位置。
如果其後股價能夠重新升穿這個高位,便可能代表市場經歷一輪沽壓後,買方再次取得短期優勢。
黃昏之星則使用相反方向的分析邏輯。
需要特別說明,Level 2 是用來解釋指標背後的盤路研究概念。
本指標沒有直接讀取 Level 2 報價、訂單流或市場深度資料。
所有 BUY/SELL 訊號均由陰陽燭價格數據計算。
### 5. 指標功能
*自動識別陰陽燭形態*
程式自動尋找符合條件的早晨之星及黃昏之星。
*自動尋找基準 K 線*
早晨之星出現後,程式尋找第一根跌穿前根低位的陰燭。
黃昏之星出現後,程式尋找第一根升穿前根高位的陽燭。
*突破確認 BUY/SELL 訊號*
程式利用基準 K 線的最高價或最低價作為參考,當後續價格突破指定位置,才產生相應的入市訊號。
*動態參考價位*
當基準 K 線確立後,程式會在圖表顯示等待突破的參考價位。
*自訂圖表顯示*
使用者可以自行決定是否顯示:
- 早晨之星及黃昏之星標記。
- 基準 K 線標記。
- BUY/SELL 訊號。
- 突破參考價位。
各種訊號及參考線的顏色亦可以自行設定。
*狀態資訊面板(Status Dashboard)*
新版加入可自由開關的狀態資訊面板,讓使用者了解目前指標的確認階段。
面板包含三種狀態:
- *INACTIVE*:目前沒有正在追蹤的有效形態。
- *WAITING REF*:已出現早晨之星或黃昏之星,正在等待符合條件的基準 K 線。
- *WAITING BREAK*:已找到基準 K 線,正在等待價格突破參考位置。
如果目前正在等待突破,面板亦會顯示相應的參考價格。
面板只提供資訊,不會影響原本 BUY/SELL 訊號的計算。
*TradingView Alerts*
指標提供 BUY 及 SELL Alert 條件,使用者可以透過 TradingView 的警報功能設定通知。
### 6. 使用方法
將指標加入 TradingView 陰陽燭圖表後,程式便會自動識別早晨之星及黃昏之星。
當早晨之星出現時,圖表會在相應 K 線下方顯示標記。
當黃昏之星出現時,圖表會在相應 K 線上方顯示標記。
接下來,程式會開始尋找符合要求的基準 K 線。
找到後,便會記錄相應的最高價或最低價,並顯示等待突破的參考線。
當後面的 K 線突破指定位置,圖表便會顯示 BUY 或 SELL 訊號。
需要注意,訊號會在突破所在的 K 線收市後才確認。
不過,突破條件是利用 K 線的最高價或最低價判斷,並不要求收市價一定要維持在參考位置之外。
這個指標可以應用於不同股份及時間框架,包括 1 分鐘、5 分鐘等 Day Trading 圖表。
使用者亦可以透過狀態資訊面板,查看目前訊號正在等待哪一個確認階段。
### 7. 指標的研究理念
傳統技術分析經常透過增加 RSI、MACD、移動平均線及其他技術指標,嘗試改善原有交易訊號。
不過,筆者認為,改良一個交易方法,未必需要不斷增加新的技術指標。
有時候,只要重新思考價格形成的過程,研究市場在不同階段的買賣盤變化,便可能找到值得進一步測試的新入市方法。
這個指標就是其中一個例子。
整個判斷過程可以概括為:
*反轉形態出現 → 等待合資格回調 K 線 → 記錄重要參考價位 → 等待重新突破 → 確認 BUY/SELL*
這個方法並不是假設第三根陽燭越強,股價之後就一定越容易上升。
相反,它將最初的反轉形態,以及之後真正值得考慮入市的位置,分開處理。
透過這種方式,可以將傳統陰陽燭形態轉化成一套具有明確條件、可以量化及測試的入市訊號。
### 8. 使用限制及風險
本指標主要用於技術分析、價格形態研究及教學用途,並不是完整的自動交易系統。
程式沒有加入自動下單、止盈、止蝕或資金管理功能。
即使股價重新突破基準 K 線的參考位置,亦不代表反轉一定成功。
在市場波動較大、橫行或流動性突然改變的情況下,仍然可能出現錯誤訊號。
目前版本沒有為基準價位設定固定有效期限。當突破條件未成立時,程式會繼續追蹤相關價位,直至觸發突破或被新的合資格形態取代。
另外,指標沒有直接利用成交量、Level 2 市場深度或訂單流失衡作為入市條件。
本指標沒有宣稱任何保證勝率或盈利能力。
建議使用者先在不同股份、市場環境及時間框架進行測試,再自行配合適當的風險管理方法使用。
### Overview
Morning Star and Evening Star are two classic candlestick reversal patterns widely used in technical analysis. Traditional interpretations generally focus on the strength of the third candle, assuming that a larger candle body and increased trading volume indicate a stronger reversal signal.
However, a strong reversal candle does not necessarily provide an ideal entry point, particularly in short-term Day Trading.
After a sharp upward movement, aggressive buying may begin to weaken, while some short-term traders start taking profits. This can create fresh selling pressure, causing prices to pull back even after a seemingly strong Morning Star pattern.
The same principle can apply in reverse to Evening Star patterns.
This indicator introduces a different approach to analyzing these traditional candlestick formations.
*Instead of generating an immediate entry signal when a Morning Star or Evening Star is completed, the indicator waits for a specific pullback structure and requires a subsequent price breakout before confirming a BUY or SELL signal.*
The objective is to examine whether the original reversal direction can reassert itself after an additional round of opposing price movement.
### 1. Morning Star Detection
The indicator identifies a Morning Star using three consecutive candlesticks.
The following conditions must be satisfied:
1. The first candle must be bearish.
2. The second candle must have a relatively small real body, less than 50% of the first candle's body.
3. The third candle must be bullish.
4. The third candle must close above the midpoint of the first candle's real body.
Once these conditions are satisfied, the Morning Star is identified.
However, the indicator does not immediately generate a BUY signal.
Instead, it enters a reference-candle detection stage.
### 2. Morning Star – Pullback and BUY Confirmation
After detecting a Morning Star, the indicator searches for the first subsequent bearish candle meeting two conditions:
- The candle must close below its opening price.
- Its low must fall below the previous candle's low.
This candle becomes the bullish setup's reference candle.
The indicator records its highest price as the reference level.
A BUY signal is generated only when a subsequent candle trades above this reference high.
The rationale is that the initial bullish reversal may attract short-term profit-taking. Waiting for a qualifying bearish pullback candle allows the indicator to observe an additional downward price movement before considering an entry.
If buyers subsequently push prices above the reference candle's high, this may indicate that buying pressure is reasserting itself.
Rather than immediately chasing the third bullish candle of a Morning Star, the indicator requires a second price-based confirmation.
### 3. Evening Star – Pullback and SELL Confirmation
The Evening Star follows the opposite logic.
The pattern is identified when:
1. The first candle is bullish.
2. The second candle's real body is smaller than 50% of the first candle's body.
3. The third candle is bearish.
4. The third candle closes below the midpoint of the first candle's real body.
After detecting an Evening Star, the indicator searches for the first subsequent bullish candle whose high exceeds the previous candle's high.
The low of this bullish reference candle becomes the critical reference price.
A SELL signal is generated only when a later candle trades below that reference low.
This confirmation attempts to identify situations where an initial bearish reversal is followed by an upward correction, after which sellers regain short-term control.
### 4. The Market Microstructure Concept Behind the Indicator
The underlying research concept is inspired by the relationship between candlestick formations, short-term price action, and Level 2 market depth.
Consider a Morning Star pattern.
During the third bullish candle, aggressive buyers may repeatedly execute trades at the Ask, consuming available sell orders and driving prices higher.
As buying continues, liquidity at nearby Ask levels may temporarily decline, allowing prices to move upward rapidly.
However, after this bullish candle is completed, additional sell orders may appear at higher price levels.
Some short-term traders who entered during the initial advance may also begin taking profits.
Consequently, a strong bullish candle does not necessarily guarantee further upward movement.
A temporary pullback may develop even when the original reversal pattern appears convincing.
This indicator uses a price-based confirmation process to examine what happens after that initial move.
First, it waits for a bearish candle that breaks the previous candle's low.
Then, it monitors whether prices can recover and break above the bearish reference candle's high.
*The key concept is that the strength of the initial reversal and the quality of the subsequent entry point are two different considerations.*
The indicator applies the same concept in reverse to Evening Star patterns.
Level 2 order-book behavior provides the theoretical explanation for this approach. However, the indicator itself does not directly access Level 2 data, order flow, or market-depth information.
All signals are calculated using candlestick price data.
### 5. Indicator Features
*Automatic Pattern Recognition*
The indicator automatically identifies Morning Star and Evening Star patterns based on predefined candlestick conditions.
*Reference Candle Detection*
After identifying a reversal pattern, the indicator searches for the first qualifying pullback candle and records its relevant high or low.
*Breakout Confirmation*
BUY and SELL signals are generated only after prices subsequently break the reference candle's designated level.
*Dynamic Reference Price Levels*
The indicator displays the reference price while the corresponding setup is waiting for breakout confirmation.
*Customizable Chart Visualization*
Users can independently enable or disable:
- Morning Star and Evening Star markers.
- Reference candle markers.
- BUY and SELL signal labels.
- Reference price levels.
Colors for the different signals and reference lines can also be customized.
*Status Dashboard*
The indicator includes an optional status dashboard showing the current confirmation stage for bullish and bearish setups.
The dashboard displays three possible states:
- *INACTIVE:* No active setup is currently being tracked in that direction.
- *WAITING REF:* A reversal pattern has been detected, and the indicator is waiting for a qualifying reference candle.
- *WAITING BREAK:* A qualifying reference candle has been identified, and the indicator is waiting for a breakout.
When a setup is waiting for breakout confirmation, the dashboard also displays its reference price.
The dashboard is informational only and does not affect the underlying signal calculations.
*Trading Alerts*
Alert conditions are available for BUY and SELL signals.
These alerts can be configured using TradingView's standard alert system.
### 6. How to Use the Indicator
Apply the indicator to a TradingView candlestick chart.
When a Morning Star is detected, a marker appears below the corresponding candle.
When an Evening Star is detected, a marker appears above the candle.
The indicator then searches for the qualifying reference candle.
Once a reference candle is found, its relevant high or low is tracked as the breakout level.
A BUY or SELL label appears when a subsequent candle breaches the corresponding reference level.
Signals are confirmed only after the breakout candle closes.
However, the breakout condition is evaluated using the candle's high or low. The closing price is not required to remain beyond the reference level.
The indicator can be used to research different instruments and chart timeframes, including intraday charts such as 1-minute and 5-minute intervals.
Users can also monitor the dashboard to understand which confirmation stage is currently active.
### 7. Design Philosophy
Many traditional candlestick strategies attempt to improve signal quality by adding additional technical indicators, moving averages, oscillators, or volatility filters.
This indicator adopts a different research approach.
Rather than introducing multiple unrelated technical conditions, it focuses on the sequence of price movements following a traditional reversal pattern.
The process can be summarized as:
*Reversal Pattern → Qualifying Pullback Candle → Reference Price → Breakout Confirmation*
This structure provides clearly defined and reproducible entry conditions.
The purpose is not to assume that a stronger Morning Star or Evening Star will always produce a better trade.
Instead, the indicator attempts to distinguish the initial reversal movement from a later potential entry opportunity.
### 8. Important Limitations
This indicator is intended for technical analysis, price-action research, and educational purposes.
It is not a complete automated trading strategy.
The indicator does not include automatic trade execution, stop-loss placement, take-profit management, or position sizing.
A breakout above or below a reference candle does not guarantee that the reversal will continue.
False signals may occur during volatile markets, sideways price movement, or sudden liquidity changes.
A setup's reference level remains active until its breakout condition is triggered or a new qualifying pattern resets that direction's tracking process. The current version does not impose a fixed expiration period.
The indicator does not directly analyze trading volume, Level 2 market depth, or order-flow imbalance.
Its signals have not been presented as having any guaranteed win rate or profitability.
Users should evaluate its behavior across different market environments, instruments, and timeframes, and apply appropriate risk-management procedures before using its signals in live trading.
---
## 中文說明(繁體中文)
### 指標簡介
早晨之星(Morning Star)及黃昏之星(Evening Star)是傳統技術分析中非常常見的陰陽燭反轉形態。
一般技術分析方法認為,早晨之星第三根陽燭的實體越長、成交量越大,代表買盤力量越強,反轉訊號亦越值得留意。
不過,筆者認為,在 Day Trading 中,一根非常強的反轉陽燭,並不一定代表這根 K 線完成後立即買入,就是最理想的入市位置。
當股價短時間內快速上升,主動買盤可能開始減弱,而部分已經獲利的短線交易者亦可能開始平倉,令市場重新出現沽壓。
因此,即使早晨之星第三根陽燭非常強,之後股價仍然可能先出現明顯回落。
黃昏之星亦可能出現相反的情況。
本指標採用一種與傳統技術分析不同的研究方法。
*不在早晨之星或黃昏之星完成後立即產生入市訊號,而是等待特定的回調 K 線出現,再利用後續價格突破確認 BUY 或 SELL。*
這個方法的核心,是研究市場在經歷一輪反方向價格移動後,原本的反轉方向能否重新取得優勢。
### 1. 早晨之星的判斷條件
程式首先尋找由三根 K 線組成的早晨之星。
必須符合以下條件:
1. 第一根 K 線是陰燭。
2. 第二根 K 線的實體較細,必須小於第一根陰燭實體的 50%。
3. 第三根 K 線是陽燭。
4. 第三根陽燭的收市價,必須高於第一根陰燭實體的中位數。
當這些條件全部成立,程式便確認出現早晨之星。
不過,這時候不會立即產生 BUY 訊號。
程式會進入下一個階段,開始尋找符合要求的基準陰燭。
### 2. 早晨之星:等待回調後的 BUY 訊號
當早晨之星出現後,程式會尋找隨後第一根同時符合以下條件的 K 線:
- 必須是陰燭,即收市價低於開市價。
- 最低價必須跌穿前一根 K 線的最低價。
找到這根陰燭後,程式便將它定義為基準陰燭,並記錄它的最高價。
這個最高價將成為重要的突破參考位置。
只有當後面的 K 線重新升穿這個最高價,程式才會產生 BUY 訊號。
這個做法的原因,是早晨之星第三根陽燭上升期間,可能已經有不少短線交易者入市。
當股價升至較高位置,部分投資者可能開始獲利平倉,導致價格回落。
如果市場在經歷這一輪回落後,買方仍然能夠將價格重新推高,甚至突破剛才基準陰燭的最高價,便可能代表買盤重新取得短期優勢。
相比在第三根大陽燭完成後立即追入,這個方法要求市場提供多一次價格確認。
### 3. 黃昏之星:等待反彈後的 SELL 訊號
黃昏之星使用完全相反的判斷邏輯。
首先,程式尋找以下形態:
1. 第一根 K 線是陽燭。
2. 第二根 K 線的實體小於第一根陽燭實體的 50%。
3. 第三根 K 線是陰燭。
4. 第三根陰燭的收市價,必須低於第一根陽燭實體的中位數。
當黃昏之星完成後,程式不會立即產生 SELL 訊號。
相反,程式會等待第一根最高價升穿前一根 K 線最高價的陽燭。
找到後,將這根陽燭的最低價記錄下來,作為沽空的參考位置。
當後面的 K 線重新跌穿這個最低價,才產生 SELL 訊號。
這個做法是希望觀察市場在經歷一次向上反彈後,賣方能否重新取得短期優勢。
### 4. 指標背後的 Level 2 盤路分析概念
這個指標的研究概念,來自對陰陽燭、價格路徑及 Level 2 市場深度的觀察。
以早晨之星作為例子。
當第三根陽燭形成期間,市場可能出現大量主動買盤,不斷以 Ask 價成交,逐步消化上方的賣盤掛單。
如果 Ask 一方的掛單被快速消化,而上方幾個價位的掛單相對薄弱,股價就可能在短時間內快速上升,形成一根實體相當長的陽燭。
不過,大家要留意,剛才有大量主動買盤,不代表之後仍然會有同樣強度的買盤。
當第三根陽燭完成後,原本被消化的 Ask 掛單,可能在較高價位重新出現。
另外,部分已經持有帳面利潤的 Day Trader 亦可能開始獲利平倉。
這些行為都可能令股價出現回落。
因此,*第三根陽燭的強度,與這根陽燭完成後是否值得立即買入,其實是兩個不同的問題。*
本指標會等待市場先出現一根跌穿前根低位的陰燭,再將這根陰燭的最高價作為重要參考位置。
如果其後股價能夠重新升穿這個高位,便可能代表市場經歷一輪沽壓後,買方再次取得短期優勢。
黃昏之星則使用相反方向的分析邏輯。
需要特別說明,Level 2 是用來解釋指標背後的盤路研究概念。
本指標沒有直接讀取 Level 2 報價、訂單流或市場深度資料。
所有 BUY/SELL 訊號均由陰陽燭價格數據計算。
### 5. 指標功能
*自動識別陰陽燭形態*
程式自動尋找符合條件的早晨之星及黃昏之星。
*自動尋找基準 K 線*
早晨之星出現後,程式尋找第一根跌穿前根低位的陰燭。
黃昏之星出現後,程式尋找第一根升穿前根高位的陽燭。
*突破確認 BUY/SELL 訊號*
程式利用基準 K 線的最高價或最低價作為參考,當後續價格突破指定位置,才產生相應的入市訊號。
*動態參考價位*
當基準 K 線確立後,程式會在圖表顯示等待突破的參考價位。
*自訂圖表顯示*
使用者可以自行決定是否顯示:
- 早晨之星及黃昏之星標記。
- 基準 K 線標記。
- BUY/SELL 訊號。
- 突破參考價位。
各種訊號及參考線的顏色亦可以自行設定。
*狀態資訊面板(Status Dashboard)*
新版加入可自由開關的狀態資訊面板,讓使用者了解目前指標的確認階段。
面板包含三種狀態:
- *INACTIVE*:目前沒有正在追蹤的有效形態。
- *WAITING REF*:已出現早晨之星或黃昏之星,正在等待符合條件的基準 K 線。
- *WAITING BREAK*:已找到基準 K 線,正在等待價格突破參考位置。
如果目前正在等待突破,面板亦會顯示相應的參考價格。
面板只提供資訊,不會影響原本 BUY/SELL 訊號的計算。
*TradingView Alerts*
指標提供 BUY 及 SELL Alert 條件,使用者可以透過 TradingView 的警報功能設定通知。
### 6. 使用方法
將指標加入 TradingView 陰陽燭圖表後,程式便會自動識別早晨之星及黃昏之星。
當早晨之星出現時,圖表會在相應 K 線下方顯示標記。
當黃昏之星出現時,圖表會在相應 K 線上方顯示標記。
接下來,程式會開始尋找符合要求的基準 K 線。
找到後,便會記錄相應的最高價或最低價,並顯示等待突破的參考線。
當後面的 K 線突破指定位置,圖表便會顯示 BUY 或 SELL 訊號。
需要注意,訊號會在突破所在的 K 線收市後才確認。
不過,突破條件是利用 K 線的最高價或最低價判斷,並不要求收市價一定要維持在參考位置之外。
這個指標可以應用於不同股份及時間框架,包括 1 分鐘、5 分鐘等 Day Trading 圖表。
使用者亦可以透過狀態資訊面板,查看目前訊號正在等待哪一個確認階段。
### 7. 指標的研究理念
傳統技術分析經常透過增加 RSI、MACD、移動平均線及其他技術指標,嘗試改善原有交易訊號。
不過,筆者認為,改良一個交易方法,未必需要不斷增加新的技術指標。
有時候,只要重新思考價格形成的過程,研究市場在不同階段的買賣盤變化,便可能找到值得進一步測試的新入市方法。
這個指標就是其中一個例子。
整個判斷過程可以概括為:
*反轉形態出現 → 等待合資格回調 K 線 → 記錄重要參考價位 → 等待重新突破 → 確認 BUY/SELL*
這個方法並不是假設第三根陽燭越強,股價之後就一定越容易上升。
相反,它將最初的反轉形態,以及之後真正值得考慮入市的位置,分開處理。
透過這種方式,可以將傳統陰陽燭形態轉化成一套具有明確條件、可以量化及測試的入市訊號。
### 8. 使用限制及風險
本指標主要用於技術分析、價格形態研究及教學用途,並不是完整的自動交易系統。
程式沒有加入自動下單、止盈、止蝕或資金管理功能。
即使股價重新突破基準 K 線的參考位置,亦不代表反轉一定成功。
在市場波動較大、橫行或流動性突然改變的情況下,仍然可能出現錯誤訊號。
目前版本沒有為基準價位設定固定有效期限。當突破條件未成立時,程式會繼續追蹤相關價位,直至觸發突破或被新的合資格形態取代。
另外,指標沒有直接利用成交量、Level 2 市場深度或訂單流失衡作為入市條件。
本指標沒有宣稱任何保證勝率或盈利能力。
建議使用者先在不同股份、市場環境及時間框架進行測試,再自行配合適當的風險管理方法使用。

Feragatname
Bilgiler ve yayınlar, TradingView tarafından sağlanan veya onaylanan finansal, yatırım, alım satım veya diğer türden tavsiye veya öneriler anlamına gelmez ve teşkil etmez. Kullanım Koşulları bölümünde daha fazlasını okuyun.
Feragatname
Bilgiler ve yayınlar, TradingView tarafından sağlanan veya onaylanan finansal, yatırım, alım satım veya diğer türden tavsiye veya öneriler anlamına gelmez ve teşkil etmez. Kullanım Koşulları bölümünde daha fazlasını okuyun.