OPEN-SOURCE SCRIPT
Strong Daily Candle | ProjectSyndicate
Strong Daily Candle
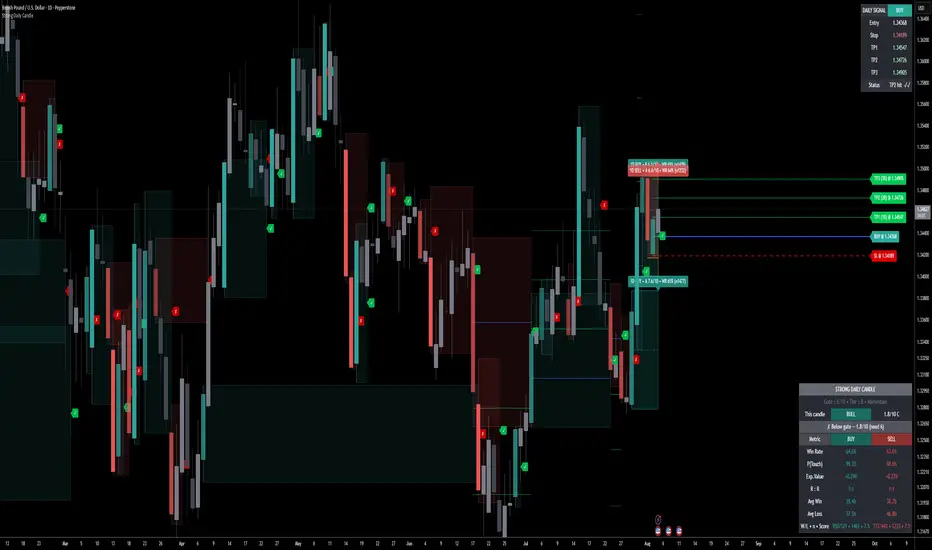
Strong Daily Candle grades the one candle that every institution, fund and algo actually settles on — the daily close — and refuses to trade until that candle proves it was a day of real conviction. Every daily bar is scored 0–10 on its raw power: how much of its range is decisive body, how hard it closed toward the extreme, how far it expanded beyond its own average range, how little it got rejected against its direction, and whether volume showed up to back it. Only when a day earns a high enough score does the tool project a full trade from it — entry, stop and three targets — and then honestly track how that setup resolved. It is built to run on the Daily (1D) chart, where a "strong candle" means a strong day.
Most candle tools just slap a name on a shape — "engulfing", "marubozu", "pin bar" — and leave you to guess whether it mattered. This one measures the day's conviction on a graded scale, gates every setup behind a strength threshold you control, turns the qualifying candle into a structured trade, and keeps an honest on-chart tally of how those setups played out. No pattern-spotting. A number, a tier, and a plan.
📊 The 0–10 Daily Strength Engine — the core. Every daily candle is scored on five institutional tells and summed to a 0–10 ceiling: BODY DOMINANCE (how much of the range is real body vs wick), CLOSE POSITION (how tightly it closed into the extreme in its own direction), RANGE EXPANSION (today's range measured against ATR — an expansion day vs a nothing day), OPPOSITE-WICK SMALLNESS (a strong bull with no upper rejection, a strong bear with no lower rejection), and VOLUME EXPANSION (did participation confirm the move). A clean, decisive trend day scores high; a wide-wicked, indecisive doti-day scores low — automatically, on every bar.
🎯 One Gate, You Set It. The whole point: nothing plots, colours or counts unless the day clears your strength gate — default 6.0/10. Raise it to 7 or 8 for only the most violent, one-sided days; drop it to see more. This is the filter that turns "every candle" into "only the days worth trading".
🏅 Tiered Quality (C → B → A → S). On top of the raw score, every qualifying day is stamped with a tier — S (≥ 8.0), A (≥ 6.5), B (≥ 5.0), C (below) — so you can read conviction at a glance and gate by tier as well as by number. S-tier days are the cleanest expressions of one-directional intent the market prints.
🧭 Momentum or Fade — you choose the thesis. MOMENTUM (default): a strong bull day = BUY, a strong bear day = SELL — you trade with the day's proven force, entering on the pullback. FADE: the logic inverts — a strong bull day = SELL — for traders who want to counter an over-extended, exhausted move back toward value. One toggle, two completely different playbooks off the same engine.
🧱 Auto Trade Levels — the qualifying day becomes a plan. The instant a day closes strong enough, the tool projects: an ENTRY (50% of the body, 50% of the range, or the candle close — your pick), a STRUCTURAL STOP just beyond the day's low (BUY) or high (SELL) with an adjustable buffer, and TP1 / TP2 / TP3 at your chosen R multiples (default 1R / 2R / 3R). The latest setup is drawn live on the chart with entry, stop and all three targets labelled.
🟩 Direction-Coloured Setup Zones. Each qualifying day drops a demand/supply zone — built from the candle body or full range — with a 50% midline. BUY zones are always teal, SELL zones are always red, active or closed, so a bullish setup never masquerades as a red box. When a zone closes it keeps its direction colour and gets a clean ✓ / ✗ outcome tag; every winning setup also draws its full Entry / SL / TP ladder into history so you can see exactly how it ran.
🧾 Live DAILY SIGNAL Panel. A fixed panel prints the current plan — direction, Entry, Stop, TP1/2/3 — and a live STATUS that walks the trade in real time: PENDING (waiting for the pullback fill) → FILLED → TP1 hit → TP2 hit → TP3 HIT, or STOPPED OUT. You always know where the latest setup stands without measuring anything.
📈 Honest Win-Rate Dashboard — separated BUY vs SELL. The dashboard tallies how the gated setups actually resolved on your chart: WIN RATE, P(TOUCH) (how often price even reached the entry), EXPECTANCY in R, R:R, average WIN and LOSS duration in days, and a running W/L · sample size · average score. Every closed setup is counted — winners and losers alike — and when a single day could hit both stop and target, it is booked pessimistically as a loss. The numbers are never flattered.
🌗 This-Candle Live Read. At the top of the dashboard, the still-forming day shows its live score, tier and direction, plus a banner that tells you plainly: ✓ a strong setup is forming, ✗ it's below the gate (and by how much), it's a flat/doji day with no direction, or you're not on a Daily chart. You see the day building toward — or failing — the gate in real time.
🎨 Fully Themed & Configurable. Strength gate and minimum tier, momentum/fade logic, entry model, stop buffer and R targets, optional filters (rejection-wick filter, EMA trend filter, minimum range × ATR), zone source (body or range), active/historic colours and transparencies, historic colour mode (by direction or by win/loss), outcome tags, midline, label and dashboard sizing, zone caps, dashboard position, and full alertconditions for BUY, SELL, zone touch and zone proximity.
🔒 Honest, Non-Repaint Core. The "this candle" read updates intrabar as the day forms — inherent to showing a live daily candle, not a defect. But every committed output — the setup zone, the entry/stop/targets, and the statistics — is locked to the CONFIRMED daily close and never redraws afterward to flatter the chart. The 0–10 scores are descriptive ranking frameworks for directing attention, and the dashboard is an on-chart simulation of the fixed-R model over your history — not a guarantee of future results.
🚀 Built for the Daily chart, any market. Forex, indices, metals, crypto, equities — anywhere a daily candle carries meaning. The Daily-timeframe guard is on by default so the engine only runs where it's designed to; advanced users can disable it to score any chart's candles.
🎯 How To Trade It — Trade The Day That Proved Itself
⏱️ Load the indicator on a Daily (1D) chart — the whole model is a read on the daily candle. Set your gate (start at 6.0) and your logic (Momentum by default).
Everything hinges on one read: the day just closed with graded, measurable conviction — trade the pullback expecting that force to continue, or, in Fade mode, trade the snap-back when the day over-extended.
◾ 1) Strong-day continuation (the core thesis — Momentum mode)
Use when a daily candle closes strong enough to clear your gate.
▪️ A strong BULL day scores ≥ gate → a teal BUY zone drops on the candle with entry, stop and targets projected. ▪️ Wait for price to rotate back into the zone — ideally to the 50% body / midline — rather than chasing the close. ▪️ Entry: long on the reaction inside the buy zone; the higher the score and tier (A/S), the more the day insisted on that direction. ▪️ Stop: below the day's low (auto-placed) — if price accepts beneath it, the day's control failed; stand aside. ▪️ Targets: TP1 (1R) to bank, then TP2 / TP3 as the continuation extends.
The mirror applies to a strong BEAR day → red SELL zone up top: fade rallies into it, stop above the day's high, targets down.
◾ 2) Let the tier size the trade
▪️ S / A-tier days are the cleanest one-directional intent — press these with confidence. ▪️ B-tier days clear a lower bar — demand extra confluence or trade them smaller. ▪️ Want fewer, higher-quality setups? Raise the gate to 7–8 and the minimum tier to A. The engine simply shows you less, and better.
◾ 3) Fade mode — trade exhaustion, not continuation
▪️ After an over-stretched big day slams into a higher-timeframe level, switch to Fade: a strong bull day becomes a counter-trend SELL back toward value. ▪️ Best used with context — a spent extreme, a prior swing, a session's end — not blindly against every strong close.
◾ 4) Stand down — the map says wait
▪️ Doji / flat day → no direction → no setup drew → no edge this day. ▪️ Below-gate day → the move lacked body, expansion or conviction → the banner reads ✗. ▪️ Price already accepted through the zone → the level is spent. Let the next daily close reset the map.
Rule of thumb: ⭐ A high-score, high-tier daily candle + price rotating back into its graded zone + your gate respected → trade the continuation with the day's force. ⭐ A weak, wicky, below-gate or already-consumed day → stand down until the next close sets a new map.
⚠️ IMPORTANT NOTICE: Strong Daily Candle is a structure- and conviction-mapping tool for the Daily timeframe. The 0–10 strength score is a descriptive ranking of a candle's geometry and volume — a model of behaviour, NOT exchange order-flow data, NOT a backtested signal, and NOT a standalone trade trigger. The on-chart statistics are a simulation of the fixed-R setup logic over your chart's own history under pessimistic (stop-first) assumptions; they describe the past, not the future. Trading strong-candle continuations and fades still carries real risk of failed levels and stop-outs. Always combine it with your own strategy, price-action analysis, higher-timeframe context and risk management. Past behaviour does not guarantee future results.
Strong Daily Candle grades the one candle that every institution, fund and algo actually settles on — the daily close — and refuses to trade until that candle proves it was a day of real conviction. Every daily bar is scored 0–10 on its raw power: how much of its range is decisive body, how hard it closed toward the extreme, how far it expanded beyond its own average range, how little it got rejected against its direction, and whether volume showed up to back it. Only when a day earns a high enough score does the tool project a full trade from it — entry, stop and three targets — and then honestly track how that setup resolved. It is built to run on the Daily (1D) chart, where a "strong candle" means a strong day.
Most candle tools just slap a name on a shape — "engulfing", "marubozu", "pin bar" — and leave you to guess whether it mattered. This one measures the day's conviction on a graded scale, gates every setup behind a strength threshold you control, turns the qualifying candle into a structured trade, and keeps an honest on-chart tally of how those setups played out. No pattern-spotting. A number, a tier, and a plan.
📊 The 0–10 Daily Strength Engine — the core. Every daily candle is scored on five institutional tells and summed to a 0–10 ceiling: BODY DOMINANCE (how much of the range is real body vs wick), CLOSE POSITION (how tightly it closed into the extreme in its own direction), RANGE EXPANSION (today's range measured against ATR — an expansion day vs a nothing day), OPPOSITE-WICK SMALLNESS (a strong bull with no upper rejection, a strong bear with no lower rejection), and VOLUME EXPANSION (did participation confirm the move). A clean, decisive trend day scores high; a wide-wicked, indecisive doti-day scores low — automatically, on every bar.
🎯 One Gate, You Set It. The whole point: nothing plots, colours or counts unless the day clears your strength gate — default 6.0/10. Raise it to 7 or 8 for only the most violent, one-sided days; drop it to see more. This is the filter that turns "every candle" into "only the days worth trading".
🏅 Tiered Quality (C → B → A → S). On top of the raw score, every qualifying day is stamped with a tier — S (≥ 8.0), A (≥ 6.5), B (≥ 5.0), C (below) — so you can read conviction at a glance and gate by tier as well as by number. S-tier days are the cleanest expressions of one-directional intent the market prints.
🧭 Momentum or Fade — you choose the thesis. MOMENTUM (default): a strong bull day = BUY, a strong bear day = SELL — you trade with the day's proven force, entering on the pullback. FADE: the logic inverts — a strong bull day = SELL — for traders who want to counter an over-extended, exhausted move back toward value. One toggle, two completely different playbooks off the same engine.
🧱 Auto Trade Levels — the qualifying day becomes a plan. The instant a day closes strong enough, the tool projects: an ENTRY (50% of the body, 50% of the range, or the candle close — your pick), a STRUCTURAL STOP just beyond the day's low (BUY) or high (SELL) with an adjustable buffer, and TP1 / TP2 / TP3 at your chosen R multiples (default 1R / 2R / 3R). The latest setup is drawn live on the chart with entry, stop and all three targets labelled.
🟩 Direction-Coloured Setup Zones. Each qualifying day drops a demand/supply zone — built from the candle body or full range — with a 50% midline. BUY zones are always teal, SELL zones are always red, active or closed, so a bullish setup never masquerades as a red box. When a zone closes it keeps its direction colour and gets a clean ✓ / ✗ outcome tag; every winning setup also draws its full Entry / SL / TP ladder into history so you can see exactly how it ran.
🧾 Live DAILY SIGNAL Panel. A fixed panel prints the current plan — direction, Entry, Stop, TP1/2/3 — and a live STATUS that walks the trade in real time: PENDING (waiting for the pullback fill) → FILLED → TP1 hit → TP2 hit → TP3 HIT, or STOPPED OUT. You always know where the latest setup stands without measuring anything.
📈 Honest Win-Rate Dashboard — separated BUY vs SELL. The dashboard tallies how the gated setups actually resolved on your chart: WIN RATE, P(TOUCH) (how often price even reached the entry), EXPECTANCY in R, R:R, average WIN and LOSS duration in days, and a running W/L · sample size · average score. Every closed setup is counted — winners and losers alike — and when a single day could hit both stop and target, it is booked pessimistically as a loss. The numbers are never flattered.
🌗 This-Candle Live Read. At the top of the dashboard, the still-forming day shows its live score, tier and direction, plus a banner that tells you plainly: ✓ a strong setup is forming, ✗ it's below the gate (and by how much), it's a flat/doji day with no direction, or you're not on a Daily chart. You see the day building toward — or failing — the gate in real time.
🎨 Fully Themed & Configurable. Strength gate and minimum tier, momentum/fade logic, entry model, stop buffer and R targets, optional filters (rejection-wick filter, EMA trend filter, minimum range × ATR), zone source (body or range), active/historic colours and transparencies, historic colour mode (by direction or by win/loss), outcome tags, midline, label and dashboard sizing, zone caps, dashboard position, and full alertconditions for BUY, SELL, zone touch and zone proximity.
🔒 Honest, Non-Repaint Core. The "this candle" read updates intrabar as the day forms — inherent to showing a live daily candle, not a defect. But every committed output — the setup zone, the entry/stop/targets, and the statistics — is locked to the CONFIRMED daily close and never redraws afterward to flatter the chart. The 0–10 scores are descriptive ranking frameworks for directing attention, and the dashboard is an on-chart simulation of the fixed-R model over your history — not a guarantee of future results.
🚀 Built for the Daily chart, any market. Forex, indices, metals, crypto, equities — anywhere a daily candle carries meaning. The Daily-timeframe guard is on by default so the engine only runs where it's designed to; advanced users can disable it to score any chart's candles.
🎯 How To Trade It — Trade The Day That Proved Itself
⏱️ Load the indicator on a Daily (1D) chart — the whole model is a read on the daily candle. Set your gate (start at 6.0) and your logic (Momentum by default).
Everything hinges on one read: the day just closed with graded, measurable conviction — trade the pullback expecting that force to continue, or, in Fade mode, trade the snap-back when the day over-extended.
◾ 1) Strong-day continuation (the core thesis — Momentum mode)
Use when a daily candle closes strong enough to clear your gate.
▪️ A strong BULL day scores ≥ gate → a teal BUY zone drops on the candle with entry, stop and targets projected. ▪️ Wait for price to rotate back into the zone — ideally to the 50% body / midline — rather than chasing the close. ▪️ Entry: long on the reaction inside the buy zone; the higher the score and tier (A/S), the more the day insisted on that direction. ▪️ Stop: below the day's low (auto-placed) — if price accepts beneath it, the day's control failed; stand aside. ▪️ Targets: TP1 (1R) to bank, then TP2 / TP3 as the continuation extends.
The mirror applies to a strong BEAR day → red SELL zone up top: fade rallies into it, stop above the day's high, targets down.
◾ 2) Let the tier size the trade
▪️ S / A-tier days are the cleanest one-directional intent — press these with confidence. ▪️ B-tier days clear a lower bar — demand extra confluence or trade them smaller. ▪️ Want fewer, higher-quality setups? Raise the gate to 7–8 and the minimum tier to A. The engine simply shows you less, and better.
◾ 3) Fade mode — trade exhaustion, not continuation
▪️ After an over-stretched big day slams into a higher-timeframe level, switch to Fade: a strong bull day becomes a counter-trend SELL back toward value. ▪️ Best used with context — a spent extreme, a prior swing, a session's end — not blindly against every strong close.
◾ 4) Stand down — the map says wait
▪️ Doji / flat day → no direction → no setup drew → no edge this day. ▪️ Below-gate day → the move lacked body, expansion or conviction → the banner reads ✗. ▪️ Price already accepted through the zone → the level is spent. Let the next daily close reset the map.
Rule of thumb: ⭐ A high-score, high-tier daily candle + price rotating back into its graded zone + your gate respected → trade the continuation with the day's force. ⭐ A weak, wicky, below-gate or already-consumed day → stand down until the next close sets a new map.
⚠️ IMPORTANT NOTICE: Strong Daily Candle is a structure- and conviction-mapping tool for the Daily timeframe. The 0–10 strength score is a descriptive ranking of a candle's geometry and volume — a model of behaviour, NOT exchange order-flow data, NOT a backtested signal, and NOT a standalone trade trigger. The on-chart statistics are a simulation of the fixed-R setup logic over your chart's own history under pessimistic (stop-first) assumptions; they describe the past, not the future. Trading strong-candle continuations and fades still carries real risk of failed levels and stop-outs. Always combine it with your own strategy, price-action analysis, higher-timeframe context and risk management. Past behaviour does not guarantee future results.
Açık kaynak kodlu komut dosyası
Gerçek TradingView ruhuyla, bu komut dosyasının mimarı, yatırımcıların işlevselliğini inceleyip doğrulayabilmesi için onu açık kaynaklı hale getirdi. Yazarı tebrik ederiz! Ücretsiz olarak kullanabilseniz de, kodu yeniden yayınlamanın Topluluk Kurallarımıza tabi olduğunu unutmayın.

Institutional-desk research · 10+ yrs building trading algos stocks options FX
Algo systems for gold/FX traders · levels desk: Gold FX NQ ES JPN225
Private systems for serious traders
syndicate001.com · t.me/aisyndicate001
Algo systems for gold/FX traders · levels desk: Gold FX NQ ES JPN225
Private systems for serious traders
syndicate001.com · t.me/aisyndicate001
Feragatname
Bilgiler ve yayınlar, TradingView tarafından sağlanan veya onaylanan finansal, yatırım, alım satım veya diğer türden tavsiye veya öneriler anlamına gelmez ve teşkil etmez. Kullanım Koşulları bölümünde daha fazlasını okuyun.
Açık kaynak kodlu komut dosyası
Gerçek TradingView ruhuyla, bu komut dosyasının mimarı, yatırımcıların işlevselliğini inceleyip doğrulayabilmesi için onu açık kaynaklı hale getirdi. Yazarı tebrik ederiz! Ücretsiz olarak kullanabilseniz de, kodu yeniden yayınlamanın Topluluk Kurallarımıza tabi olduğunu unutmayın.
Institutional-desk research · 10+ yrs building trading algos stocks options FX
Algo systems for gold/FX traders · levels desk: Gold FX NQ ES JPN225
Private systems for serious traders
syndicate001.com · t.me/aisyndicate001
Algo systems for gold/FX traders · levels desk: Gold FX NQ ES JPN225
Private systems for serious traders
syndicate001.com · t.me/aisyndicate001
Feragatname
Bilgiler ve yayınlar, TradingView tarafından sağlanan veya onaylanan finansal, yatırım, alım satım veya diğer türden tavsiye veya öneriler anlamına gelmez ve teşkil etmez. Kullanım Koşulları bölümünde daha fazlasını okuyun.