Güncellendi
DivMacdObFvg
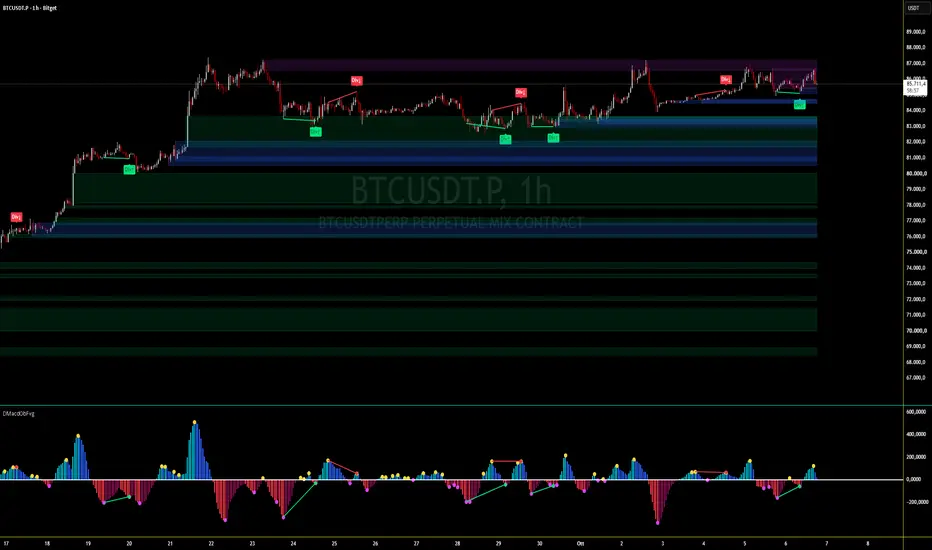
DivMacdObFvg — Indicator Description
DivMacdObFvg is a TradingView indicator designed for the 4h chart. The lower pane shows the MACD histogram with a zero line, its highs and lows confirmed by 1h closes, and divergences against price. On the price chart it draws the same divergences, plus Order Blocks and Fair Value Gaps that are still valid. It is not a strategy: it does not open or close orders, it only flags points where momentum and price zones coincide.
How It Works
MACD Histogram (12/26/9)
The color shows momentum and direction:
Aqua: above zero and rising.
Blue: above zero but falling.
Red: below zero and falling.
Maroon: below zero but rising.
Highs and Lows (yellow and fuchsia dots)
A yellow dot marks a histogram high above zero, a fuchsia dot marks a histogram low below zero. The signal is confirmed by the first 1h close of the following 4h candle: if the histogram recalculated with that close has already turned down (or up) from the extreme, the extreme is considered valid. The dot is drawn on the 4h candle that actually made the extreme, so it appears with a delay of about 1-2 hours rather than at candle close.
Divergences (Div↑ / Div↓)
The script finds histogram pivots (5 bars left, 3 bars right) and compares them with the price lows or highs at the same points:
Bullish: price makes a lower low, the histogram makes a higher low (and below zero). Bearish momentum is fading.
Bearish: price makes a higher high, the histogram makes a lower high (and above zero).
Lines are drawn on both the histogram and the price chart. A pivot is confirmed 3 bars later, which is about 12 hours after the extreme.
FVG (lime bullish, orange bearish)
The empty space between the high of the candle two bars back and the low of the current candle (or the reverse), after an impulsive candle and only if larger than 0.3 ATR. The box extends to the right until a close fills the gap, then it is deleted.
Order Blocks (blue bullish, purple bearish)
When price closes above the last pivot high, the bullish OB is the candle with the lowest low between that pivot and the break. The bearish case is the mirror image. The OB disappears when a close crosses the opposite side of the box (mitigated).
Entry and Exit (Operational Outline)
The script does not trade by itself, so what follows is an outline you can apply by reading the signals. It has not been backtested.
Long
Setup: a Div↑ or a fuchsia dot appears. Bearish momentum is fading.
Zone: price is inside or near a blue OB or a lime FVG.
Entry: at the close of the 4h candle where the histogram turns maroon (below zero but rising), or with a limit order at the upper edge of the zone.
Stop: below the bottom of the OB (or below the divergence pivot low), with a margin of about 0.5 ATR. If a candle closes below the bottom of the OB, the script deletes the box: that is the natural invalidation.
Exit: partial at the yellow dot or a Div↓, or at the first bearish zone above (purple OB or orange FVG). The remainder when the histogram turns blue after being aqua, or at a fixed risk/reward ratio (1.5-2).
Short: same outline reversed, with Div↓ or a yellow dot, price in a purple OB or orange FVG, stop above the upper edge of the OB, target at the first bullish zone below.
Limitations
Divergence delay: when Div↑ or Div↓ appears, price has already moved for about 12 hours. Entering at market after the signal can significantly worsen risk/reward, which is why waiting for a return to the zone is preferable.
Strong trends: in a decisive trend, divergences can appear several times before a reversal. They are not enough on their own; the OB/FVG zone acts as a filter.
1h confirmation: the provisional histogram is not the final one, so a dot can appear and the 4h candle can still close higher or lower.
Zones: with obSwingLen = 5 on 4h, OBs are numerous. With 8-10 you get fewer and more significant ones.
Disclaimer
Not financial advice. This indicator and its description are provided for educational and informational purposes only. Nothing here constitutes investment advice, a recommendation, or an offer to buy or sell any financial instrument. The author is not a licensed financial advisor.
DivMacdObFvg is a TradingView indicator designed for the 4h chart. The lower pane shows the MACD histogram with a zero line, its highs and lows confirmed by 1h closes, and divergences against price. On the price chart it draws the same divergences, plus Order Blocks and Fair Value Gaps that are still valid. It is not a strategy: it does not open or close orders, it only flags points where momentum and price zones coincide.
How It Works
MACD Histogram (12/26/9)
The color shows momentum and direction:
Aqua: above zero and rising.
Blue: above zero but falling.
Red: below zero and falling.
Maroon: below zero but rising.
Highs and Lows (yellow and fuchsia dots)
A yellow dot marks a histogram high above zero, a fuchsia dot marks a histogram low below zero. The signal is confirmed by the first 1h close of the following 4h candle: if the histogram recalculated with that close has already turned down (or up) from the extreme, the extreme is considered valid. The dot is drawn on the 4h candle that actually made the extreme, so it appears with a delay of about 1-2 hours rather than at candle close.
Divergences (Div↑ / Div↓)
The script finds histogram pivots (5 bars left, 3 bars right) and compares them with the price lows or highs at the same points:
Bullish: price makes a lower low, the histogram makes a higher low (and below zero). Bearish momentum is fading.
Bearish: price makes a higher high, the histogram makes a lower high (and above zero).
Lines are drawn on both the histogram and the price chart. A pivot is confirmed 3 bars later, which is about 12 hours after the extreme.
FVG (lime bullish, orange bearish)
The empty space between the high of the candle two bars back and the low of the current candle (or the reverse), after an impulsive candle and only if larger than 0.3 ATR. The box extends to the right until a close fills the gap, then it is deleted.
Order Blocks (blue bullish, purple bearish)
When price closes above the last pivot high, the bullish OB is the candle with the lowest low between that pivot and the break. The bearish case is the mirror image. The OB disappears when a close crosses the opposite side of the box (mitigated).
Entry and Exit (Operational Outline)
The script does not trade by itself, so what follows is an outline you can apply by reading the signals. It has not been backtested.
Long
Setup: a Div↑ or a fuchsia dot appears. Bearish momentum is fading.
Zone: price is inside or near a blue OB or a lime FVG.
Entry: at the close of the 4h candle where the histogram turns maroon (below zero but rising), or with a limit order at the upper edge of the zone.
Stop: below the bottom of the OB (or below the divergence pivot low), with a margin of about 0.5 ATR. If a candle closes below the bottom of the OB, the script deletes the box: that is the natural invalidation.
Exit: partial at the yellow dot or a Div↓, or at the first bearish zone above (purple OB or orange FVG). The remainder when the histogram turns blue after being aqua, or at a fixed risk/reward ratio (1.5-2).
Short: same outline reversed, with Div↓ or a yellow dot, price in a purple OB or orange FVG, stop above the upper edge of the OB, target at the first bullish zone below.
Limitations
Divergence delay: when Div↑ or Div↓ appears, price has already moved for about 12 hours. Entering at market after the signal can significantly worsen risk/reward, which is why waiting for a return to the zone is preferable.
Strong trends: in a decisive trend, divergences can appear several times before a reversal. They are not enough on their own; the OB/FVG zone acts as a filter.
1h confirmation: the provisional histogram is not the final one, so a dot can appear and the 4h candle can still close higher or lower.
Zones: with obSwingLen = 5 on 4h, OBs are numerous. With 8-10 you get fewer and more significant ones.
Disclaimer
Not financial advice. This indicator and its description are provided for educational and informational purposes only. Nothing here constitutes investment advice, a recommendation, or an offer to buy or sell any financial instrument. The author is not a licensed financial advisor.
Sürüm Notları
DivMacdObFvg — Changelog1. LTF Confirmation rewritten (main change)
Removed:
confirmBars input
PROVISIONAL HISTOGRAM FROM LOWER TF CLOSES block (manual reconstruction of fast/slow EMA, MACD, signal and provHist via alphaF, alphaS, sumPrev)
array<float> ltfCloses
Added:
macdHist() reusable function → single MACD definition
float histLtf = request.security(syminfo.tickerid, lowerTf, macdHist(), lookahead=barmerge.lookahead_off) → lower-TF hist on closed bars only (no repaint)
ltfDown / ltfUp → lower-TF hist direction
Effect: true lower-TF confirmation, fully consistent with the MACD parameters, no repainting. Pivots now print one lower-TF bar after the actual pivot (same visual offset as before, but now explicit and correct).
2. FVG & OB border controls (new)
FVG — new inputs:
fvgBorderC → border color (default lime)
fvgBorderW → border width 0–5 (0 = no border, default 1)
OB — new inputs:
obBullBorderC → bullish border color (default blue, previously hardcoded)
obBearBorderC → bearish border color (default purple, previously hardcoded)
obBorderW → border width 0–5 (0 = no border, default 1)
Effect: full control over border color and width. Before: FVG had no border (border_color=na), OB had fixed colors.
3. Renamed inputs (clarity)
FVG Bullish → FVG Bullish: Fill Color
OB Bullish → OB Bullish: Fill Color
Same for the bearish versions
No functional change, clearer labels only.
4. Alerts updated
"MACD hist 4h: high confirmed by 1h" → "MACD hist: high confirmed by LTF"
Same for the low
Reason: the message should not hardcode "4h/1h" — the TF depends on the chart + lowerTf chosen by the user.
What did not change
Divergence logic (regular and hidden)
FVG logic (ATR threshold, max active, delete on fill)
Order Block logic (pivot, 400-bar span, mitigation)
Histogram coloring (4 colors)
Plots, markers on price and histogram
All other inputs

Feragatname
Bilgiler ve yayınlar, TradingView tarafından sağlanan veya onaylanan finansal, yatırım, alım satım veya diğer türden tavsiye veya öneriler anlamına gelmez ve teşkil etmez. Kullanım Koşulları bölümünde daha fazlasını okuyun.
Feragatname
Bilgiler ve yayınlar, TradingView tarafından sağlanan veya onaylanan finansal, yatırım, alım satım veya diğer türden tavsiye veya öneriler anlamına gelmez ve teşkil etmez. Kullanım Koşulları bölümünde daha fazlasını okuyun.