OPEN-SOURCE SCRIPT
Güncellendi Mean Reversion Corridors [AGPro Series]
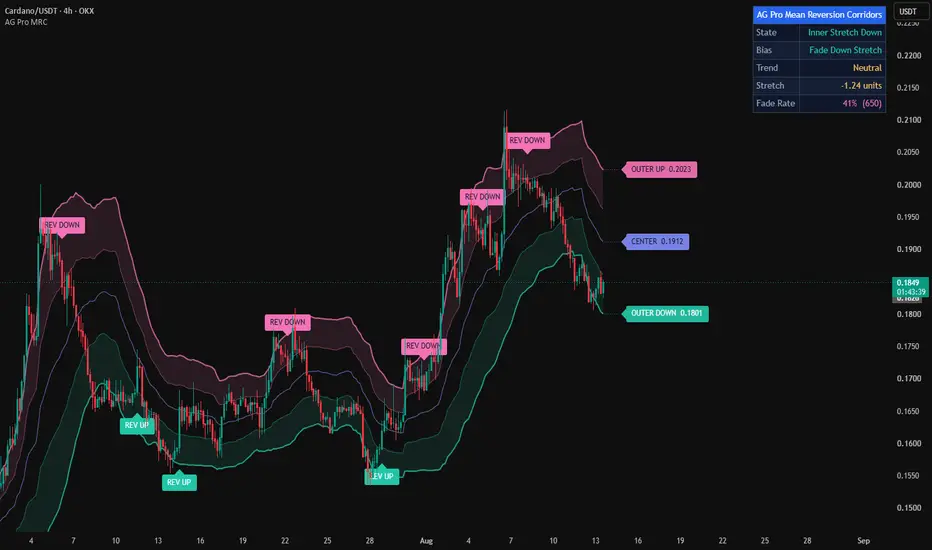
Mean Reversion Corridors [AGPro Series]
🔹 Overview
Mean Reversion Corridors is a volatility-adaptive deviation framework that maps how far price has stretched from a chosen fair-value center and classifies that stretch into two actionable zones. An inner corridor marks the early reversion band where price is meaningfully extended but not yet extreme; an outer corridor marks statistical exhaustion where continuation becomes less probable under normal conditions. A higher-timeframe trend filter separates controlled mean reversion from failure-continuation expansions, so traders can tell fading the edge from respecting a real break — all from a single clean overlay.
🔸 Unique Edge
Most band systems (Bollinger, Keltner, ATR channels) offer a single width engine and a single band pair, leaving the trader to guess whether a tag is an exhaustion or a breakout. Mean Reversion Corridors is built around three ideas that work together:
- A dual-engine width unit that linearly blends ATR (range-based) and Standard Deviation (dispersion-based) so the corridor is stable on both gap-heavy and low-dispersion regimes.
- A two-layer corridor with distinct roles — inner for early stretch, outer for exhaustion — rendered as transparent zones you can read at a glance.
- A regime-aware state machine that uses a higher-timeframe trend filter to reclassify outer tags as either reversion candidates or failure-continuation, tracked as explicit REV and FAIL states with a bounded confirmation window.
🧠 Methodology
- Center Model — user choice of EMA, VWMA (volume-aware, default) or HMA (responsive), calculated on chart closes.
- Width Unit — the current volatility unit is a linear blend: (1 − blend) × ATR + blend × StDev, protected against empty volatility periods.
- Corridors — inner band at ±(width × inner multiplier), outer band at ±(width × outer multiplier). Stretch is reported in width-unit sigma.
- Trend Filter — the same center model is evaluated on a higher-timeframe via request.security with lookahead off, and its slope is normalized by ATR so the "strong" threshold is volatility-aware, not symbol-specific.
- State Machine — tracks the most recent outer-band extreme with a rolling 20-bar confirmation window. A reversion is confirmed only when price closes back inside the inner corridor and the trend filter is not strongly aligned with the original stretch. When the trend is strongly aligned, the outer break is reclassified as corridor failure (continuation).
- All conditions evaluate on confirmed bars to avoid repainting behavior.
⚡ Signals & Alerts
On-chart markers:
- REV — reversion confirmed back through the inner band after an outer extreme, trend-filtered.
- FAIL — corridor failure / trend-aligned continuation beyond the outer band.
Six bar-close alert conditions:
- Inner corridor entered — upside stretch
- Inner corridor entered — downside stretch
- Outer corridor hit — upside exhaustion
- Outer corridor hit — downside exhaustion
- Reversion confirmed
- Corridor failure (continuation)
⚙️ Key Inputs
- Center Model — EMA / VWMA / Hull
- Center Length and Volatility Length — independent lookbacks
- ATR ↔ StDev Blend — balance between range and dispersion engines
- Inner Corridor Width and Outer Corridor Width — in volatility units
- Trend Filter — enable, timeframe, length, strength threshold
- Visuals — outer-only mode, center line, fills, edge tags, state labels, label size
- Info Panel — show/hide, position (six options), font size
- Alerts — individually toggleable for each of the six events
📖 How to Use
- Start with the defaults on your main chart timeframe. The 34-period VWMA center, balanced blend and 1.0 / 2.2 inner/outer multipliers are chosen to work as a neutral starting point across liquid markets.
- Inner corridor tags are early stretch cues — they flag that price is extended, not that a turn is due. Use them as context for setups, not as standalone signals.
- Outer corridor tags with the trend filter neutral or opposed are the primary mean reversion setup; wait for a REV confirmation back inside the inner band before acting.
- When FAIL appears, the stretch is trend-aligned; treat the outer band as continuation, not resistance. This is the signal to stop fading.
- Use the Info Panel to read current state, reversion bias, trend regime and stretch magnitude in sigma at a glance.
⚠️ Limitations & Transparency
- This is an analytical tool, not a trading strategy or financial advice. It does not predict future price.
- Band-based classification assumes statistical behavior; during shocks, news events or illiquid sessions the width engine can lag.
- The trend filter uses a higher-timeframe slope — it reacts slower than short-term momentum by design, which is the intended behavior.
- Signals are evaluated on confirmed bars; intrabar crosses are not counted as events.
- Past behavior of any indicator does not guarantee future results. Always apply your own risk management.
🔹 Overview
Mean Reversion Corridors is a volatility-adaptive deviation framework that maps how far price has stretched from a chosen fair-value center and classifies that stretch into two actionable zones. An inner corridor marks the early reversion band where price is meaningfully extended but not yet extreme; an outer corridor marks statistical exhaustion where continuation becomes less probable under normal conditions. A higher-timeframe trend filter separates controlled mean reversion from failure-continuation expansions, so traders can tell fading the edge from respecting a real break — all from a single clean overlay.
🔸 Unique Edge
Most band systems (Bollinger, Keltner, ATR channels) offer a single width engine and a single band pair, leaving the trader to guess whether a tag is an exhaustion or a breakout. Mean Reversion Corridors is built around three ideas that work together:
- A dual-engine width unit that linearly blends ATR (range-based) and Standard Deviation (dispersion-based) so the corridor is stable on both gap-heavy and low-dispersion regimes.
- A two-layer corridor with distinct roles — inner for early stretch, outer for exhaustion — rendered as transparent zones you can read at a glance.
- A regime-aware state machine that uses a higher-timeframe trend filter to reclassify outer tags as either reversion candidates or failure-continuation, tracked as explicit REV and FAIL states with a bounded confirmation window.
🧠 Methodology
- Center Model — user choice of EMA, VWMA (volume-aware, default) or HMA (responsive), calculated on chart closes.
- Width Unit — the current volatility unit is a linear blend: (1 − blend) × ATR + blend × StDev, protected against empty volatility periods.
- Corridors — inner band at ±(width × inner multiplier), outer band at ±(width × outer multiplier). Stretch is reported in width-unit sigma.
- Trend Filter — the same center model is evaluated on a higher-timeframe via request.security with lookahead off, and its slope is normalized by ATR so the "strong" threshold is volatility-aware, not symbol-specific.
- State Machine — tracks the most recent outer-band extreme with a rolling 20-bar confirmation window. A reversion is confirmed only when price closes back inside the inner corridor and the trend filter is not strongly aligned with the original stretch. When the trend is strongly aligned, the outer break is reclassified as corridor failure (continuation).
- All conditions evaluate on confirmed bars to avoid repainting behavior.
⚡ Signals & Alerts
On-chart markers:
- REV — reversion confirmed back through the inner band after an outer extreme, trend-filtered.
- FAIL — corridor failure / trend-aligned continuation beyond the outer band.
Six bar-close alert conditions:
- Inner corridor entered — upside stretch
- Inner corridor entered — downside stretch
- Outer corridor hit — upside exhaustion
- Outer corridor hit — downside exhaustion
- Reversion confirmed
- Corridor failure (continuation)
⚙️ Key Inputs
- Center Model — EMA / VWMA / Hull
- Center Length and Volatility Length — independent lookbacks
- ATR ↔ StDev Blend — balance between range and dispersion engines
- Inner Corridor Width and Outer Corridor Width — in volatility units
- Trend Filter — enable, timeframe, length, strength threshold
- Visuals — outer-only mode, center line, fills, edge tags, state labels, label size
- Info Panel — show/hide, position (six options), font size
- Alerts — individually toggleable for each of the six events
📖 How to Use
- Start with the defaults on your main chart timeframe. The 34-period VWMA center, balanced blend and 1.0 / 2.2 inner/outer multipliers are chosen to work as a neutral starting point across liquid markets.
- Inner corridor tags are early stretch cues — they flag that price is extended, not that a turn is due. Use them as context for setups, not as standalone signals.
- Outer corridor tags with the trend filter neutral or opposed are the primary mean reversion setup; wait for a REV confirmation back inside the inner band before acting.
- When FAIL appears, the stretch is trend-aligned; treat the outer band as continuation, not resistance. This is the signal to stop fading.
- Use the Info Panel to read current state, reversion bias, trend regime and stretch magnitude in sigma at a glance.
⚠️ Limitations & Transparency
- This is an analytical tool, not a trading strategy or financial advice. It does not predict future price.
- Band-based classification assumes statistical behavior; during shocks, news events or illiquid sessions the width engine can lag.
- The trend filter uses a higher-timeframe slope — it reacts slower than short-term momentum by design, which is the intended behavior.
- Signals are evaluated on confirmed bars; intrabar crosses are not counted as events.
- Past behavior of any indicator does not guarantee future results. Always apply your own risk management.
Sürüm Notları
🔧 UPDATE NOTES - V1.1This update focuses on publication polish, panel consistency, label control, and cleaner corridor visualization.
The core purpose of the script remains unchanged.
This release improves how mean-reversion stretch, trend override, corridor failure, and state labels are presented on the chart.
This script continues to function as an analytical and visualization tool.
It does not attempt to predict price direction or provide guaranteed outcomes.
------------------------
What Changed
------------------------
• Removed non-required legal text from the source header.
The script now follows the current AGPro public-free source format.
• Rebuilt the panel with the current AGPro standard.
The panel now uses a single merged blue header row, theme control, location control, and clearer state rows.
• Reworked state markers into label objects.
REV and FAIL events now respect the chart label font-size setting instead of using fixed plotshape sizing.
• Added label cooldown and maximum label retention controls.
This keeps the chart readable while preserving enough historical context.
• Improved right-side corridor tags.
Upper outer, center, and lower outer tags now update in place instead of being recreated every bar.
------------------------
Visual Improvements
------------------------
• Cleaner right-side tag behavior.
• Better state-label spacing around candles.
• More balanced default label density.
• Refined panel colors for dark, slate, and light chart themes.
------------------------
Interface & Usability
------------------------
• Added Elite Dark, Slate, and Clean Light panel themes.
• Added expanded panel locations, including center anchors.
• Added Huge support for label and panel font-size controls.
• Added Show Only Key Labels to keep event labeling focused.
------------------------
Behavior Notes
------------------------
This update does not change the corridor concept.
The goal is clearer presentation and cleaner chart interaction, not new predictive behavior.
Users should interpret center, inner corridor, outer corridor, REV labels, and FAIL labels the same way as before.
------------------------
Limitations Reminder
------------------------
The script remains a rule-based analytical tool.
Volatility, liquidity, timeframe selection, and trend-filter settings may affect how corridor states appear.
Outputs should always be interpreted within broader market context.
------------------------
Risk Reminder
------------------------
This script is for educational and analytical purposes only.
It does not provide financial advice or guaranteed trading outcomes.
Users remain responsible for their own decisions.
Sürüm Notları
🔧 UPDATE NOTES - v1.2This update focuses on readability and decision transparency.
The core purpose of the script remains unchanged.
This release hardens on-chart label contrast and adds an honest follow-through
statistic so the strength of outer-stretch fades is easier to judge.
This script continues to function as an analytical and visualization tool.
It does not attempt to predict price direction or provide guaranteed outcomes.
------------------------
What Changed
------------------------
• Stop-Aware Outer-Stretch Fade Rate
A new "Fade Rate" panel row reports how often price, after hitting an outer
corridor without an aligned trend, reverted back to the inner corridor before
stretching further into failure. A win means the inner corridor was reached
first and a loss means price stretched further beyond the outer band first,
which reuses the corridor's own inner and outer levels, now measured across
history. Fades that resolve neither way inside the window are left uncounted,
and the row shows the sample size and reads "Building" until enough fades have
completed. This adds context to the live state read without changing how the
state, bias, trend, or stretch is calculated.
• Hardened Label Contrast
The REV and FAIL state labels and the right-side corridor tags now select their
text color from the brightness of their own background, so bullish, bearish,
neutral, and accent elements stay legible. This corrects light text that
previously sat on lighter fills.
• ATR Hardening
The internal ATR reference is now protected against empty early-bar readings,
keeping corridor width, label spacing, and the fade window stable on the very
first bars of a chart and on thin or newly listed symbols.
------------------------
Visual Improvements
------------------------
• Improved chart readability by hardening label and tag contrast
• Preserved the existing center, corridors, fills, and tag layout
• Refined visual hierarchy so reversion and failure events read clearly
• Maintained the same premium presentation across panel themes
------------------------
Interface & Usability
------------------------
• Optimized panel layout with a new fade follow-through row
• Improved label readability for better chart interaction
• Adjusted default visual presentation for a more balanced appearance
• Enhanced overall user experience without changing core logic
------------------------
Behavior Notes
------------------------
This update does not change the core analytical logic of the script.
The center, corridor width, trend filter, state, and event logic behave the
same as before. The Fade Rate is an observational statistic only.
Users should interpret outputs the same way as before, but with improved visual
structure and added follow-through context.
------------------------
Limitations Reminder
------------------------
The script remains a rule-based analytical tool.
Market conditions such as volatility, liquidity, and timeframe differences may
affect how corridors, reversions, and the fade rate appear.
The fade rate is a historical observation on the current chart and does not
predict future reversions. Outputs should always be interpreted within broader
market context.
------------------------
Risk Reminder
------------------------
This script is for educational and analytical purposes only.
It does not provide financial advice or guaranteed trading outcomes.
Users remain responsible for their own decisions.
Sürüm Notları
Version 1.3 – Price-Owned Corridor RailsThis release improves right-edge level ownership and visual separation while preserving the original corridor engine, trend filter, fade proof, and alert logic.
• Added exact prices to the Outer Up, Center, and Outer Down badges.
• Added owned dotted connectors from each live corridor level to its badge.
• Added font-aware, ATR-based vertical separation for compressed corridor layouts.
• Simplified historical state badges to compact single-line REV UP, REV DOWN, FAIL UP, and FAIL DOWN markers.
• Increased candle clearance dynamically for larger label font settings.
Açık kaynak kodlu komut dosyası
Gerçek TradingView ruhuyla, bu komut dosyasının mimarı, yatırımcıların işlevselliğini inceleyip doğrulayabilmesi için onu açık kaynaklı hale getirdi. Yazarı tebrik ederiz! Ücretsiz olarak kullanabilseniz de, kodu yeniden yayınlamanın Topluluk Kurallarımıza tabi olduğunu unutmayın.

Trading Suite | Flagship Workflow :
tradingview.com/script/XJmX3p98-Trading-Suite-AGPro-Series/
Crypto Setup Planner | Multi-Symbol Analysis :
tradingview.com/script/LgVRo7Ql-Crypto-Setup-Planner-AGPro-Series/
tradingview.com/script/XJmX3p98-Trading-Suite-AGPro-Series/
Crypto Setup Planner | Multi-Symbol Analysis :
tradingview.com/script/LgVRo7Ql-Crypto-Setup-Planner-AGPro-Series/
Feragatname
Bilgiler ve yayınlar, TradingView tarafından sağlanan veya onaylanan finansal, yatırım, alım satım veya diğer türden tavsiye veya öneriler anlamına gelmez ve teşkil etmez. Kullanım Koşulları bölümünde daha fazlasını okuyun.
Açık kaynak kodlu komut dosyası
Gerçek TradingView ruhuyla, bu komut dosyasının mimarı, yatırımcıların işlevselliğini inceleyip doğrulayabilmesi için onu açık kaynaklı hale getirdi. Yazarı tebrik ederiz! Ücretsiz olarak kullanabilseniz de, kodu yeniden yayınlamanın Topluluk Kurallarımıza tabi olduğunu unutmayın.
Trading Suite | Flagship Workflow :
tradingview.com/script/XJmX3p98-Trading-Suite-AGPro-Series/
Crypto Setup Planner | Multi-Symbol Analysis :
tradingview.com/script/LgVRo7Ql-Crypto-Setup-Planner-AGPro-Series/
tradingview.com/script/XJmX3p98-Trading-Suite-AGPro-Series/
Crypto Setup Planner | Multi-Symbol Analysis :
tradingview.com/script/LgVRo7Ql-Crypto-Setup-Planner-AGPro-Series/
Feragatname
Bilgiler ve yayınlar, TradingView tarafından sağlanan veya onaylanan finansal, yatırım, alım satım veya diğer türden tavsiye veya öneriler anlamına gelmez ve teşkil etmez. Kullanım Koşulları bölümünde daha fazlasını okuyun.