OPEN-SOURCE SCRIPT
Güncellendi DANI _ MTF Pullback - RSI Panel
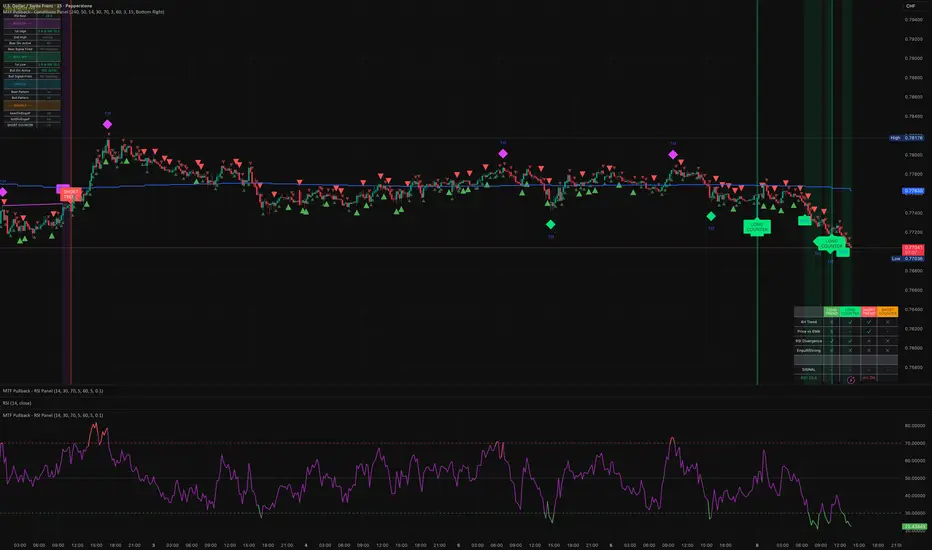
MTF Pullback - RSI Panel Summary
Purpose: Companion indicator for the main strategy that displays RSI with divergence detection in a separate pane below the price chart.
Settings
ParameterDefaultDescriptionRSI Length14Lookback period for RSI calculationRSI Oversold Level30Threshold for oversold conditionRSI Overbought Level70Threshold for overbought conditionDivergence Lookback Bars10How many bars to look back for divergence detection
What It Displays
RSI Line — Changes color based on zone:
Purple = neutral (between 30-70)
Green = oversold (below 30)
Red = overbought (above 70)
Horizontal Levels:
Red dashed line at 70 (overbought)
Green dashed line at 30 (oversold)
Gray dotted line at 50 (midpoint)
Zone Fills:
Light red shading above 70
Light green shading below 30
Divergence Markers:
"DIV" label with lime circle = bullish divergence (price makes lower low, RSI makes higher low while oversold)
"DIV" label with fuchsia circle = bearish divergence (price makes higher high, RSI makes lower high while overbought)
Background Flash:
Green flash when bullish divergence detected
Red flash when bearish divergence detected
Divergence Logic
Bullish: Price makes a lower low AND RSI makes a higher low AND RSI is in oversold territory → potential reversal up
Bearish: Price makes a higher high AND RSI makes a lower high AND RSI is in overbought territory → potential reversal down
Purpose: Companion indicator for the main strategy that displays RSI with divergence detection in a separate pane below the price chart.
Settings
ParameterDefaultDescriptionRSI Length14Lookback period for RSI calculationRSI Oversold Level30Threshold for oversold conditionRSI Overbought Level70Threshold for overbought conditionDivergence Lookback Bars10How many bars to look back for divergence detection
What It Displays
RSI Line — Changes color based on zone:
Purple = neutral (between 30-70)
Green = oversold (below 30)
Red = overbought (above 70)
Horizontal Levels:
Red dashed line at 70 (overbought)
Green dashed line at 30 (oversold)
Gray dotted line at 50 (midpoint)
Zone Fills:
Light red shading above 70
Light green shading below 30
Divergence Markers:
"DIV" label with lime circle = bullish divergence (price makes lower low, RSI makes higher low while oversold)
"DIV" label with fuchsia circle = bearish divergence (price makes higher high, RSI makes lower high while overbought)
Background Flash:
Green flash when bullish divergence detected
Red flash when bearish divergence detected
Divergence Logic
Bullish: Price makes a lower low AND RSI makes a higher low AND RSI is in oversold territory → potential reversal up
Bearish: Price makes a higher high AND RSI makes a lower high AND RSI is in overbought territory → potential reversal down
Sürüm Notları
updatesrSürüm Notları
updates dfAçık kaynak kodlu komut dosyası
Gerçek TradingView ruhuyla, bu komut dosyasının mimarı, yatırımcıların işlevselliğini inceleyip doğrulayabilmesi için onu açık kaynaklı hale getirdi. Yazarı tebrik ederiz! Ücretsiz olarak kullanabilseniz de, kodu yeniden yayınlamanın Topluluk Kurallarımıza tabi olduğunu unutmayın.

Feragatname
Bilgiler ve yayınlar, TradingView tarafından sağlanan veya onaylanan finansal, yatırım, alım satım veya diğer türden tavsiye veya öneriler anlamına gelmez ve teşkil etmez. Kullanım Koşulları bölümünde daha fazlasını okuyun.
Açık kaynak kodlu komut dosyası
Gerçek TradingView ruhuyla, bu komut dosyasının mimarı, yatırımcıların işlevselliğini inceleyip doğrulayabilmesi için onu açık kaynaklı hale getirdi. Yazarı tebrik ederiz! Ücretsiz olarak kullanabilseniz de, kodu yeniden yayınlamanın Topluluk Kurallarımıza tabi olduğunu unutmayın.
Feragatname
Bilgiler ve yayınlar, TradingView tarafından sağlanan veya onaylanan finansal, yatırım, alım satım veya diğer türden tavsiye veya öneriler anlamına gelmez ve teşkil etmez. Kullanım Koşulları bölümünde daha fazlasını okuyun.