Volatility-Squeezed Momentum Oscillator [QuantAlgo]
🟢 Overview
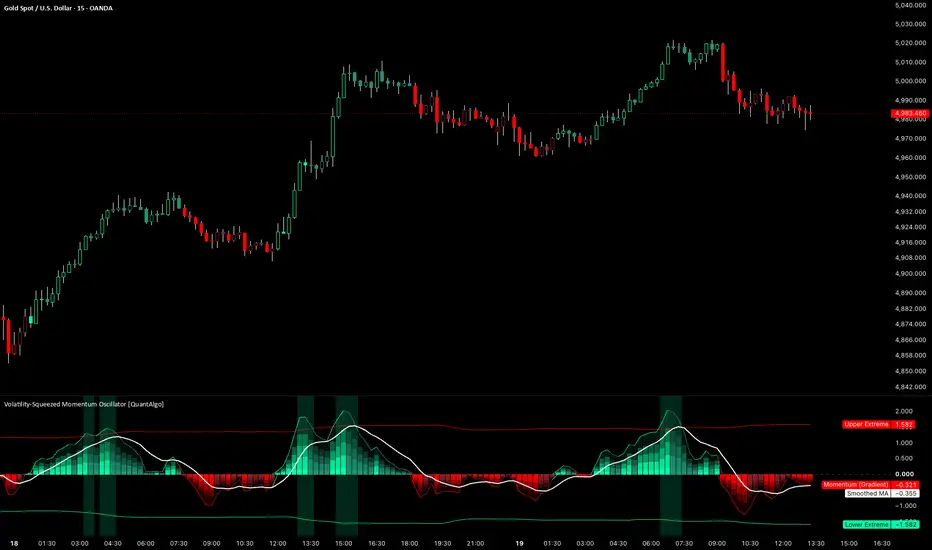
The Volatility-Squeezed Momentum Oscillator employs a normalised displacement architecture to measure momentum in a way that stays consistent across every asset and timeframe. Unlike conventional oscillators that react to raw price change or operate on a fixed scale, this indicator measures how far price has stretched from its own moving equilibrium and then divides that stretch by live volatility, compressing every reading into a common unit of measurement. This self-scaling behaviour means an extreme reading carries the same significance whether it appears on a quiet major pair or a volatile altcoin, so the histogram reflects genuine momentum conviction rather than the raw size of the instrument's underlying moves. The framework is further enhanced by adaptive extreme bands that expand and contract based on the oscillator's own dispersion, helping identify true overextended conditions instead of relying on arbitrary fixed thresholds.

🟢 How It Works
The oscillator builds its core logic around displacement, specifically how far the price source sits from a moving equilibrium that represents its recent fair value. Rather than reading raw price change like a standard momentum tool, it normalises that displacement against a live volatility estimate, so the same absolute move registers as a larger reading when conditions are calm and a smaller reading when volatility is elevated. This normalisation is what makes the histogram comparable across instruments and timeframes, since extreme always means the same thing: it is measured relative to the asset's own recent behaviour rather than against a fixed value.
The normalised displacement is then smoothed into the momentum histogram, with a separate Smoothed MA plotted over the top as a moving reference the oscillator can cross to flag a shift in momentum. The extreme bands are derived from the oscillator's own dispersion rather than set at fixed values, so they widen through volatile stretches and tighten through calm ones, keeping the definition of overextension adaptive to conditions. The histogram also carries acceleration shading, rendering vivid when momentum is expanding and muted when it is contracting, which separates a move that is still building from one that is fading even while it remains on the same side of zero.

🟢 How to Use It
▶ Positive Momentum (Above Zero): The histogram sits above the zero line, showing displacement skewed to the upside and momentum favouring the bulls. A vivid shade signals the upside push is still expanding, while a muted shade warns it is decelerating even though momentum remains positive. This is the environment to favour long continuation or hold existing long exposure, with the Smoothed MA serving as a reference for shifts in the momentum trend.
▶ Negative Momentum (Below Zero): The histogram sits below zero, showing downside displacement and bearish momentum. A vivid shade marks expanding downside pressure, while a muted shade signals the selling is losing force. This favours short positioning or reduction of long risk, again with the Smoothed MA acting as a reference for momentum transitions.
▶ Extreme Band Tags: When the histogram breaks beyond an adaptive band, momentum has reached a stretched state relative to its own recent range, and the pane background tints to mark the overextension zone. These tags favour a mean-reversion read, flagging conditions ripe for exhaustion rather than fresh continuation, and they carry the most weight when they coincide with the end of a directional move rather than the start of one.

🟢 Features
▶ Preconfigured Presets: Three parameter sets tailored for different trading styles and timeframes. "Default" delivers balanced momentum detection suited to swing trading on 4H and daily charts, filtering routine noise while staying responsive to genuine directional shifts. "Fast Response" shortens the equilibrium and smoothing windows and tightens the band for scalping and intraday use on 5min to 1H charts, reacting quickly to smaller moves and tagging extremes more often at the cost of more frequent state changes. "Smooth Trend" lengthens the windows and widens the band for position trading on daily and weekly charts, confirming only sustained momentum shifts and producing fewer, higher conviction extremes.

▶ Built-in Alerts: A full set of alert conditions supports automated monitoring across every signal the oscillator produces without requiring constant chart observation. Zero-cross alerts fire when momentum crosses above or below the zero line, flagging a shift into positive or negative territory, with a combined direction-change option covering both through a single setup. Smoothed MA cross alerts trigger when the oscillator crosses above or below its Smoothed MA, marking momentum shifts earlier than the zero line confirms them. Extreme break alerts fire when momentum pushes beyond the upper or lower adaptive band, signalling that the tape has reached an overextended state worth watching for exhaustion or reversal.

▶ Visual Customisation: Six colour presets (Classic, Aqua, Cosmic, Cyber, Neon, plus Custom) accommodate different chart themes and personal preferences, with coordinated bullish and bearish schemes applied consistently across the histogram, its acceleration shades, the extreme highlights and the extreme bands. A choice of histogram styles renders either a layered gradient column with a bright cap for added visual depth or a single flat histogram for simplicity, with the acceleration shading preserved in both. Optional price bar colouring tints the main chart candles with the active momentum colour, including the bright and muted acceleration shades, providing an at-a-glance read of momentum state on price without referencing the oscillator directly. Optional extreme highlighting shades the pane background whenever momentum holds beyond a band, reinforcing the overextension zones for the mean-reversion read.

🟢 Pro Tips for Trading and Investing
▶ Market context shapes how each read should be applied. The zero-line and Smoothed MA signals perform best in trending regimes where directional momentum persists, while the extreme band tags are most relevant in ranging or late-stage conditions where price is prone to snapping back. Before acting on a signal, assess the broader structure on a higher timeframe: in a confirmed uptrend, favour the positive-momentum and continuation reads and treat lower-band tags as pullback opportunities rather than reversals, then invert that logic in a confirmed downtrend. During range-bound periods, the extreme band tags carry more weight than zero crosses, which tend to whipsaw when no genuine momentum is present.
▶ Layer this Volatility-Squeezed Momentum Oscillator with complementary analysis rather than treating it as a standalone decision tool. Momentum shifts confirmed by expanding volume suggest broader participation, and extreme band tags occurring near major support or resistance carry more weight than those in open space. Watch also for divergence between price and the histogram, where price posts a new extreme but momentum fails to follow, an early warning that a directional move is losing conviction. Pairing this script with trend, volatility, or breadth indicators from our QuantAlgo toolkit can further validate directional bias before entry.
The Volatility-Squeezed Momentum Oscillator employs a normalised displacement architecture to measure momentum in a way that stays consistent across every asset and timeframe. Unlike conventional oscillators that react to raw price change or operate on a fixed scale, this indicator measures how far price has stretched from its own moving equilibrium and then divides that stretch by live volatility, compressing every reading into a common unit of measurement. This self-scaling behaviour means an extreme reading carries the same significance whether it appears on a quiet major pair or a volatile altcoin, so the histogram reflects genuine momentum conviction rather than the raw size of the instrument's underlying moves. The framework is further enhanced by adaptive extreme bands that expand and contract based on the oscillator's own dispersion, helping identify true overextended conditions instead of relying on arbitrary fixed thresholds.
🟢 How It Works
The oscillator builds its core logic around displacement, specifically how far the price source sits from a moving equilibrium that represents its recent fair value. Rather than reading raw price change like a standard momentum tool, it normalises that displacement against a live volatility estimate, so the same absolute move registers as a larger reading when conditions are calm and a smaller reading when volatility is elevated. This normalisation is what makes the histogram comparable across instruments and timeframes, since extreme always means the same thing: it is measured relative to the asset's own recent behaviour rather than against a fixed value.
The normalised displacement is then smoothed into the momentum histogram, with a separate Smoothed MA plotted over the top as a moving reference the oscillator can cross to flag a shift in momentum. The extreme bands are derived from the oscillator's own dispersion rather than set at fixed values, so they widen through volatile stretches and tighten through calm ones, keeping the definition of overextension adaptive to conditions. The histogram also carries acceleration shading, rendering vivid when momentum is expanding and muted when it is contracting, which separates a move that is still building from one that is fading even while it remains on the same side of zero.
🟢 How to Use It
▶ Positive Momentum (Above Zero): The histogram sits above the zero line, showing displacement skewed to the upside and momentum favouring the bulls. A vivid shade signals the upside push is still expanding, while a muted shade warns it is decelerating even though momentum remains positive. This is the environment to favour long continuation or hold existing long exposure, with the Smoothed MA serving as a reference for shifts in the momentum trend.
▶ Negative Momentum (Below Zero): The histogram sits below zero, showing downside displacement and bearish momentum. A vivid shade marks expanding downside pressure, while a muted shade signals the selling is losing force. This favours short positioning or reduction of long risk, again with the Smoothed MA acting as a reference for momentum transitions.
▶ Extreme Band Tags: When the histogram breaks beyond an adaptive band, momentum has reached a stretched state relative to its own recent range, and the pane background tints to mark the overextension zone. These tags favour a mean-reversion read, flagging conditions ripe for exhaustion rather than fresh continuation, and they carry the most weight when they coincide with the end of a directional move rather than the start of one.
🟢 Features
▶ Preconfigured Presets: Three parameter sets tailored for different trading styles and timeframes. "Default" delivers balanced momentum detection suited to swing trading on 4H and daily charts, filtering routine noise while staying responsive to genuine directional shifts. "Fast Response" shortens the equilibrium and smoothing windows and tightens the band for scalping and intraday use on 5min to 1H charts, reacting quickly to smaller moves and tagging extremes more often at the cost of more frequent state changes. "Smooth Trend" lengthens the windows and widens the band for position trading on daily and weekly charts, confirming only sustained momentum shifts and producing fewer, higher conviction extremes.
▶ Built-in Alerts: A full set of alert conditions supports automated monitoring across every signal the oscillator produces without requiring constant chart observation. Zero-cross alerts fire when momentum crosses above or below the zero line, flagging a shift into positive or negative territory, with a combined direction-change option covering both through a single setup. Smoothed MA cross alerts trigger when the oscillator crosses above or below its Smoothed MA, marking momentum shifts earlier than the zero line confirms them. Extreme break alerts fire when momentum pushes beyond the upper or lower adaptive band, signalling that the tape has reached an overextended state worth watching for exhaustion or reversal.
▶ Visual Customisation: Six colour presets (Classic, Aqua, Cosmic, Cyber, Neon, plus Custom) accommodate different chart themes and personal preferences, with coordinated bullish and bearish schemes applied consistently across the histogram, its acceleration shades, the extreme highlights and the extreme bands. A choice of histogram styles renders either a layered gradient column with a bright cap for added visual depth or a single flat histogram for simplicity, with the acceleration shading preserved in both. Optional price bar colouring tints the main chart candles with the active momentum colour, including the bright and muted acceleration shades, providing an at-a-glance read of momentum state on price without referencing the oscillator directly. Optional extreme highlighting shades the pane background whenever momentum holds beyond a band, reinforcing the overextension zones for the mean-reversion read.
🟢 Pro Tips for Trading and Investing
▶ Market context shapes how each read should be applied. The zero-line and Smoothed MA signals perform best in trending regimes where directional momentum persists, while the extreme band tags are most relevant in ranging or late-stage conditions where price is prone to snapping back. Before acting on a signal, assess the broader structure on a higher timeframe: in a confirmed uptrend, favour the positive-momentum and continuation reads and treat lower-band tags as pullback opportunities rather than reversals, then invert that logic in a confirmed downtrend. During range-bound periods, the extreme band tags carry more weight than zero crosses, which tend to whipsaw when no genuine momentum is present.
▶ Layer this Volatility-Squeezed Momentum Oscillator with complementary analysis rather than treating it as a standalone decision tool. Momentum shifts confirmed by expanding volume suggest broader participation, and extreme band tags occurring near major support or resistance carry more weight than those in open space. Watch also for divergence between price and the histogram, where price posts a new extreme but momentum fails to follow, an early warning that a directional move is losing conviction. Pairing this script with trend, volatility, or breadth indicators from our QuantAlgo toolkit can further validate directional bias before entry.
Ücretli Alanda Mevcut
Bu gösterge yalnızca QuantAlgo Essential abonelerine açıktır. Bu komut dosyasına ve QuantAlgo tarafından sunulan diğer komut dosyalarına erişmek için katılın.

🟢 Access our best trading & investing tools: joinquantalgo.com/plans
🟢 Free Special Edition indicators: joinquantalgo.com/special-editions
🟢 Discord: discord.gg/hJaFyGEAyX
🟢 Free Special Edition indicators: joinquantalgo.com/special-editions
🟢 Discord: discord.gg/hJaFyGEAyX
Feragatname
Bilgiler ve yayınlar, TradingView tarafından sağlanan veya onaylanan finansal, yatırım, alım satım veya diğer türden tavsiye veya öneriler anlamına gelmez ve teşkil etmez. Kullanım Koşulları bölümünde daha fazlasını okuyun.
Ücretli Alanda Mevcut
Bu gösterge yalnızca QuantAlgo Essential abonelerine açıktır. Bu komut dosyasına ve QuantAlgo tarafından sunulan diğer komut dosyalarına erişmek için katılın.
🟢 Access our best trading & investing tools: joinquantalgo.com/plans
🟢 Free Special Edition indicators: joinquantalgo.com/special-editions
🟢 Discord: discord.gg/hJaFyGEAyX
🟢 Free Special Edition indicators: joinquantalgo.com/special-editions
🟢 Discord: discord.gg/hJaFyGEAyX
Feragatname
Bilgiler ve yayınlar, TradingView tarafından sağlanan veya onaylanan finansal, yatırım, alım satım veya diğer türden tavsiye veya öneriler anlamına gelmez ve teşkil etmez. Kullanım Koşulları bölümünde daha fazlasını okuyun.